Posted by Minjeong Shin, with edits and additions by Lexing Xie
In our recent paper in IEEE VIS’19, we introduced a new visual metaphor, called the Influence Flowers to represent flow influence between academic entities including people, publication venues, institutions, and topics.
Introducing the Influence Flower
Academic profiles of scientists and organisations are engaging for both the scientific community and the general public. They help us understand individual productivity and reputation, the collective knowledge-making process, and aid decision-making. Many academic search engines such as Google Scholar, Microsoft Academic, or Scopus provide profiles of authors, affiliations, and sometimes research fields. Scholarly profiles have become a defacto tool to gain an overview of someone’s research topics, and even their academic impact. However, they do not provide the detailed stories of influence while developing scholars’ academic career. In this article, we will focus on a scholar’s academic influence over time and will introduce a new visual metaphor – the Influence Flower – for the effective storytelling.
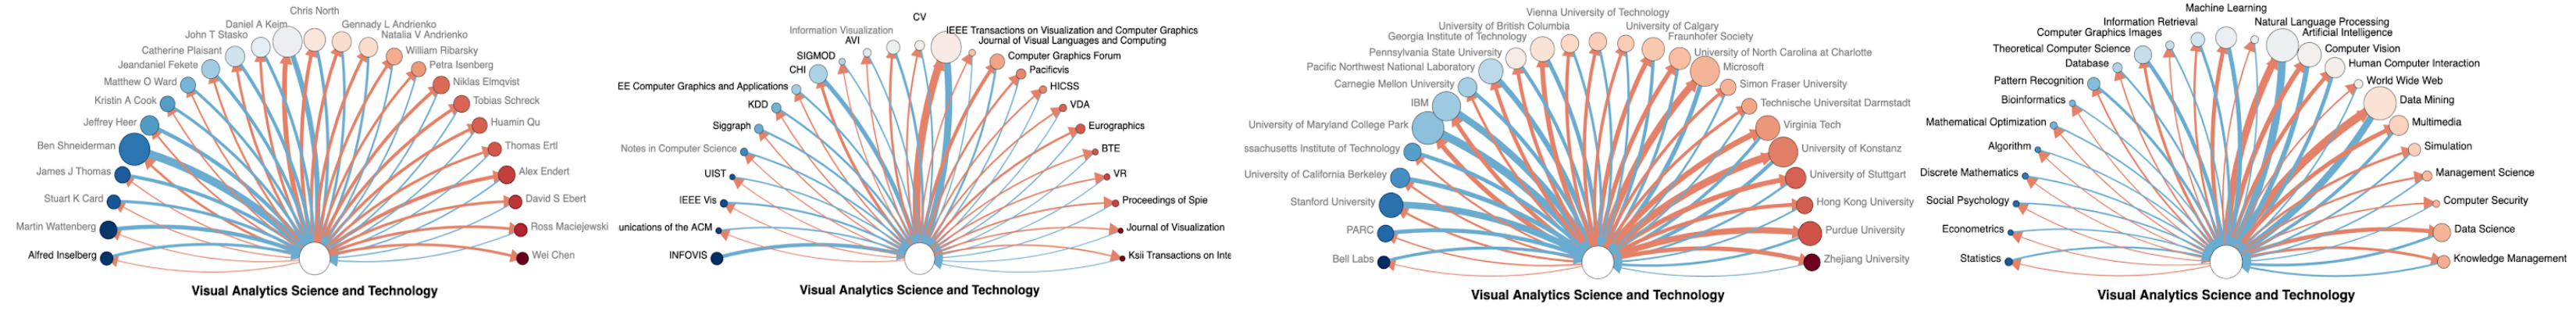
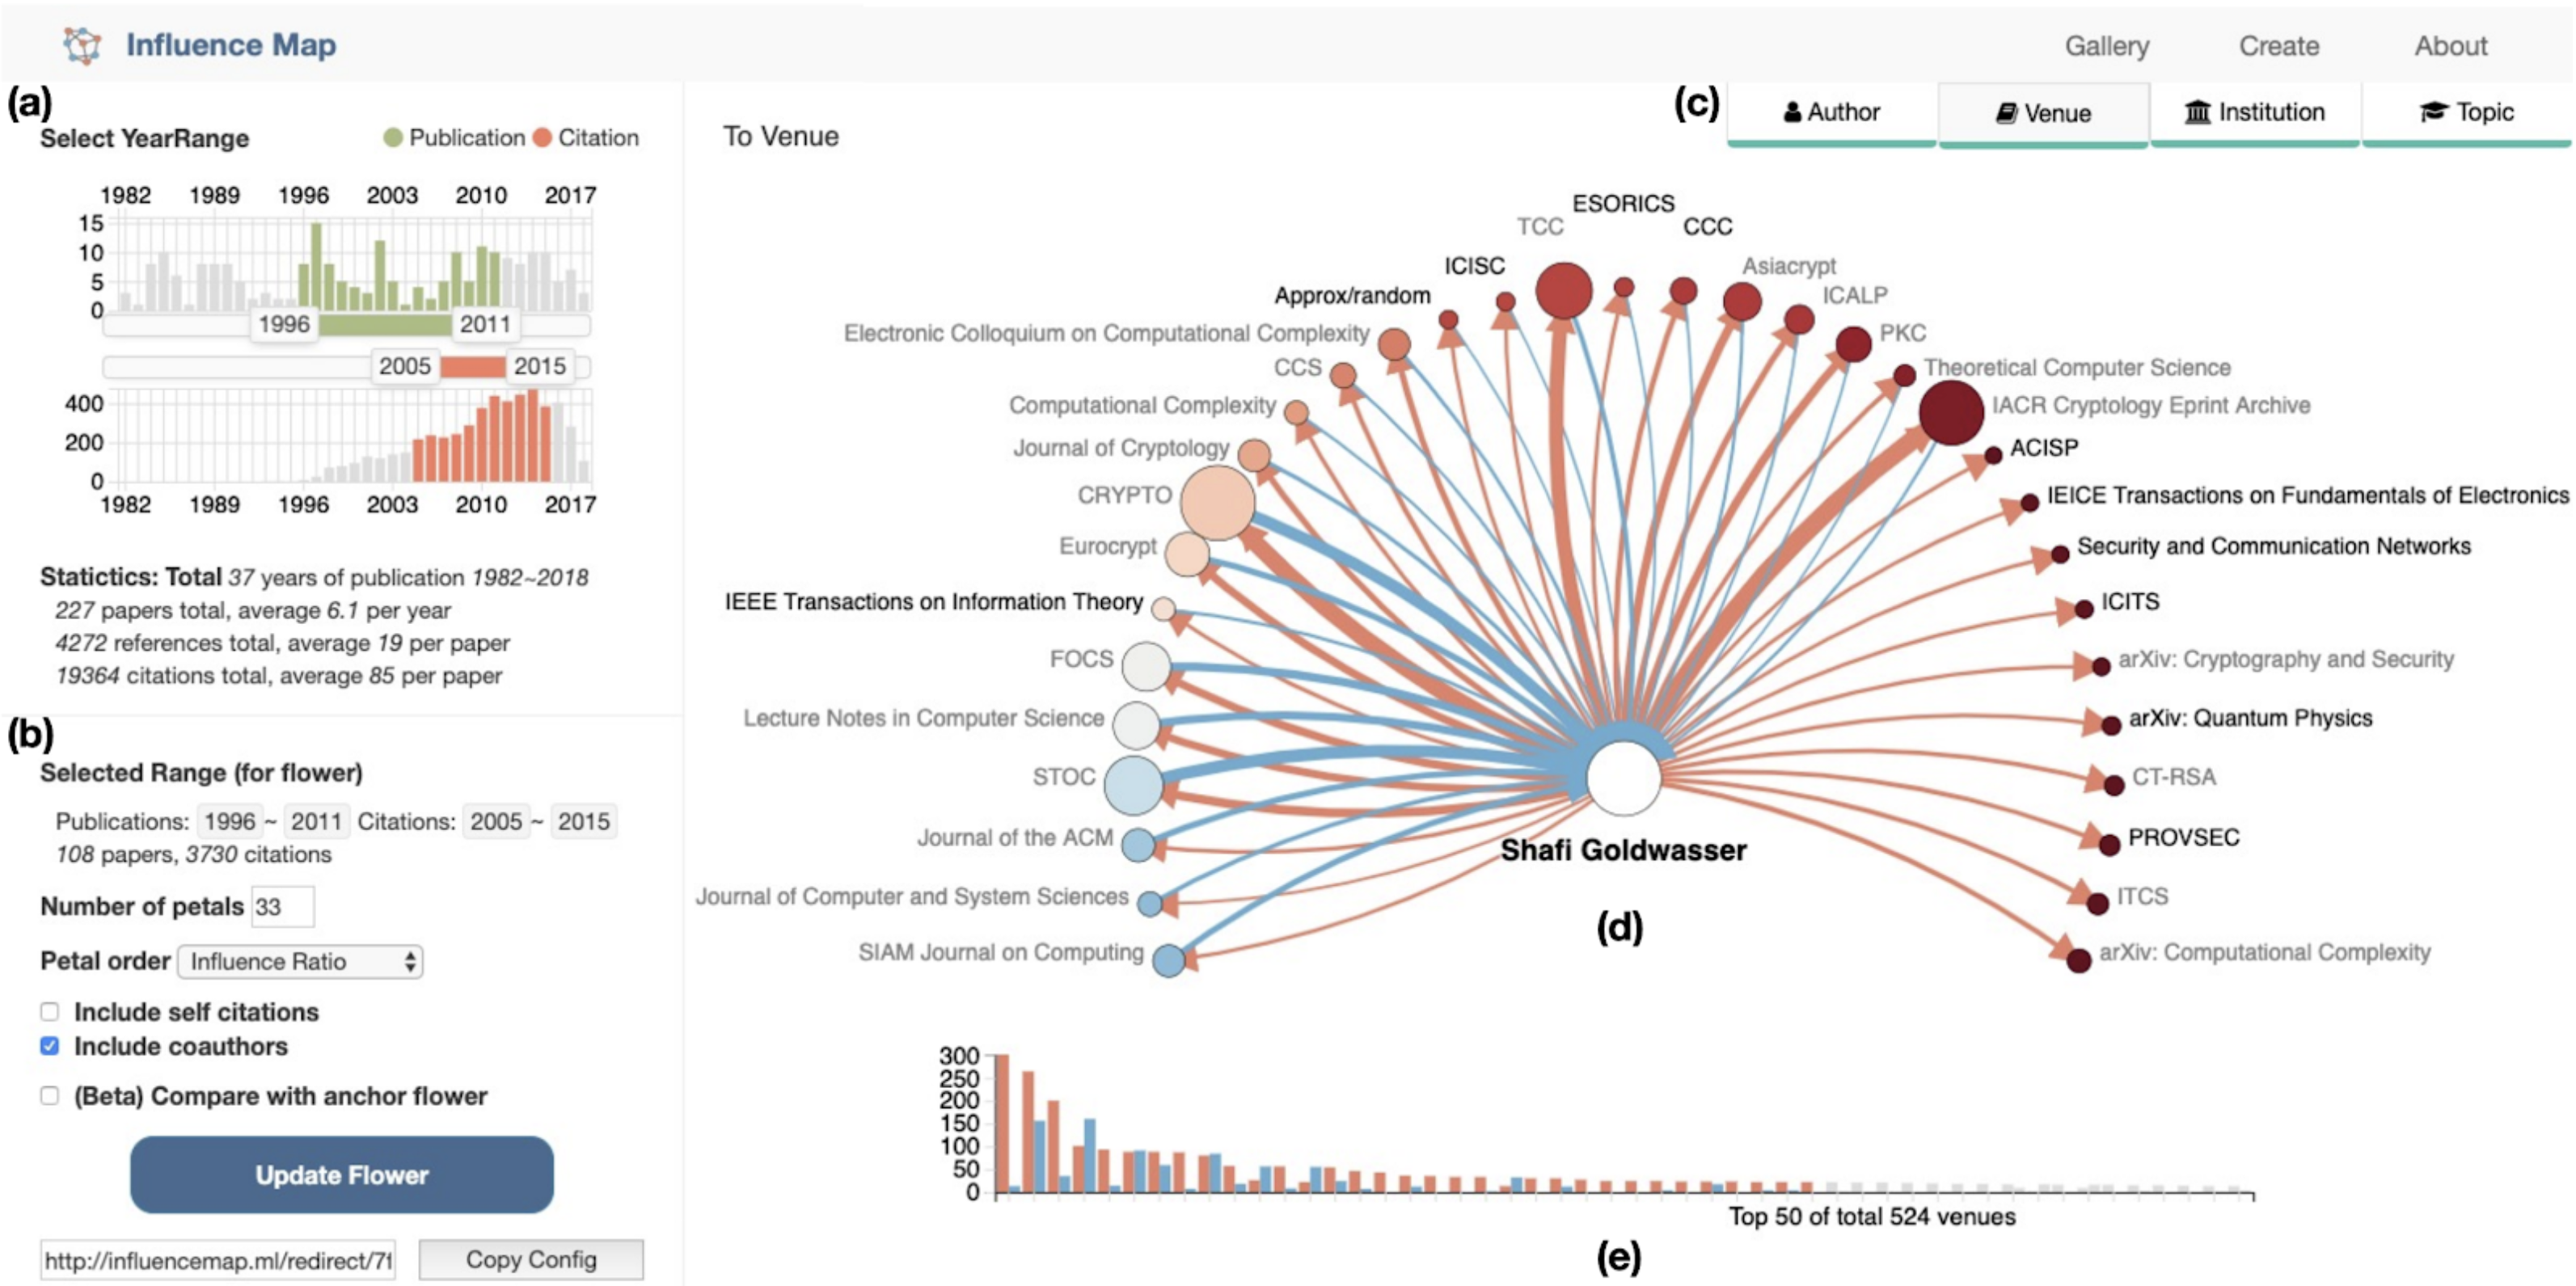
The Influence Flower is a new visual metaphor for presenting aggregated influence around a given academic entity – which could be a paper, a project, an author, an institution, a conference, a journal, or a topic, represented as a collection of papers. The Influence Flower is an ego-centric graph with the ego entity in the centre and alter nodes on a circular arc. The underlying flower theme is chosen as it is more memorable than a few numbers, and it has connotations of intellectual growth and the flourishing of ideas over time. We quantify influence using citations as the basic unit and consider the act of referencing another paper as a signal of influence. The flower petals are formed by two curved edges, whose thickness represent the strengths of influence in either direction. The size of alter nodes reflect the total volume of influence and the colour of the alter nodes reflect the ratio of incoming and outgoing influences.
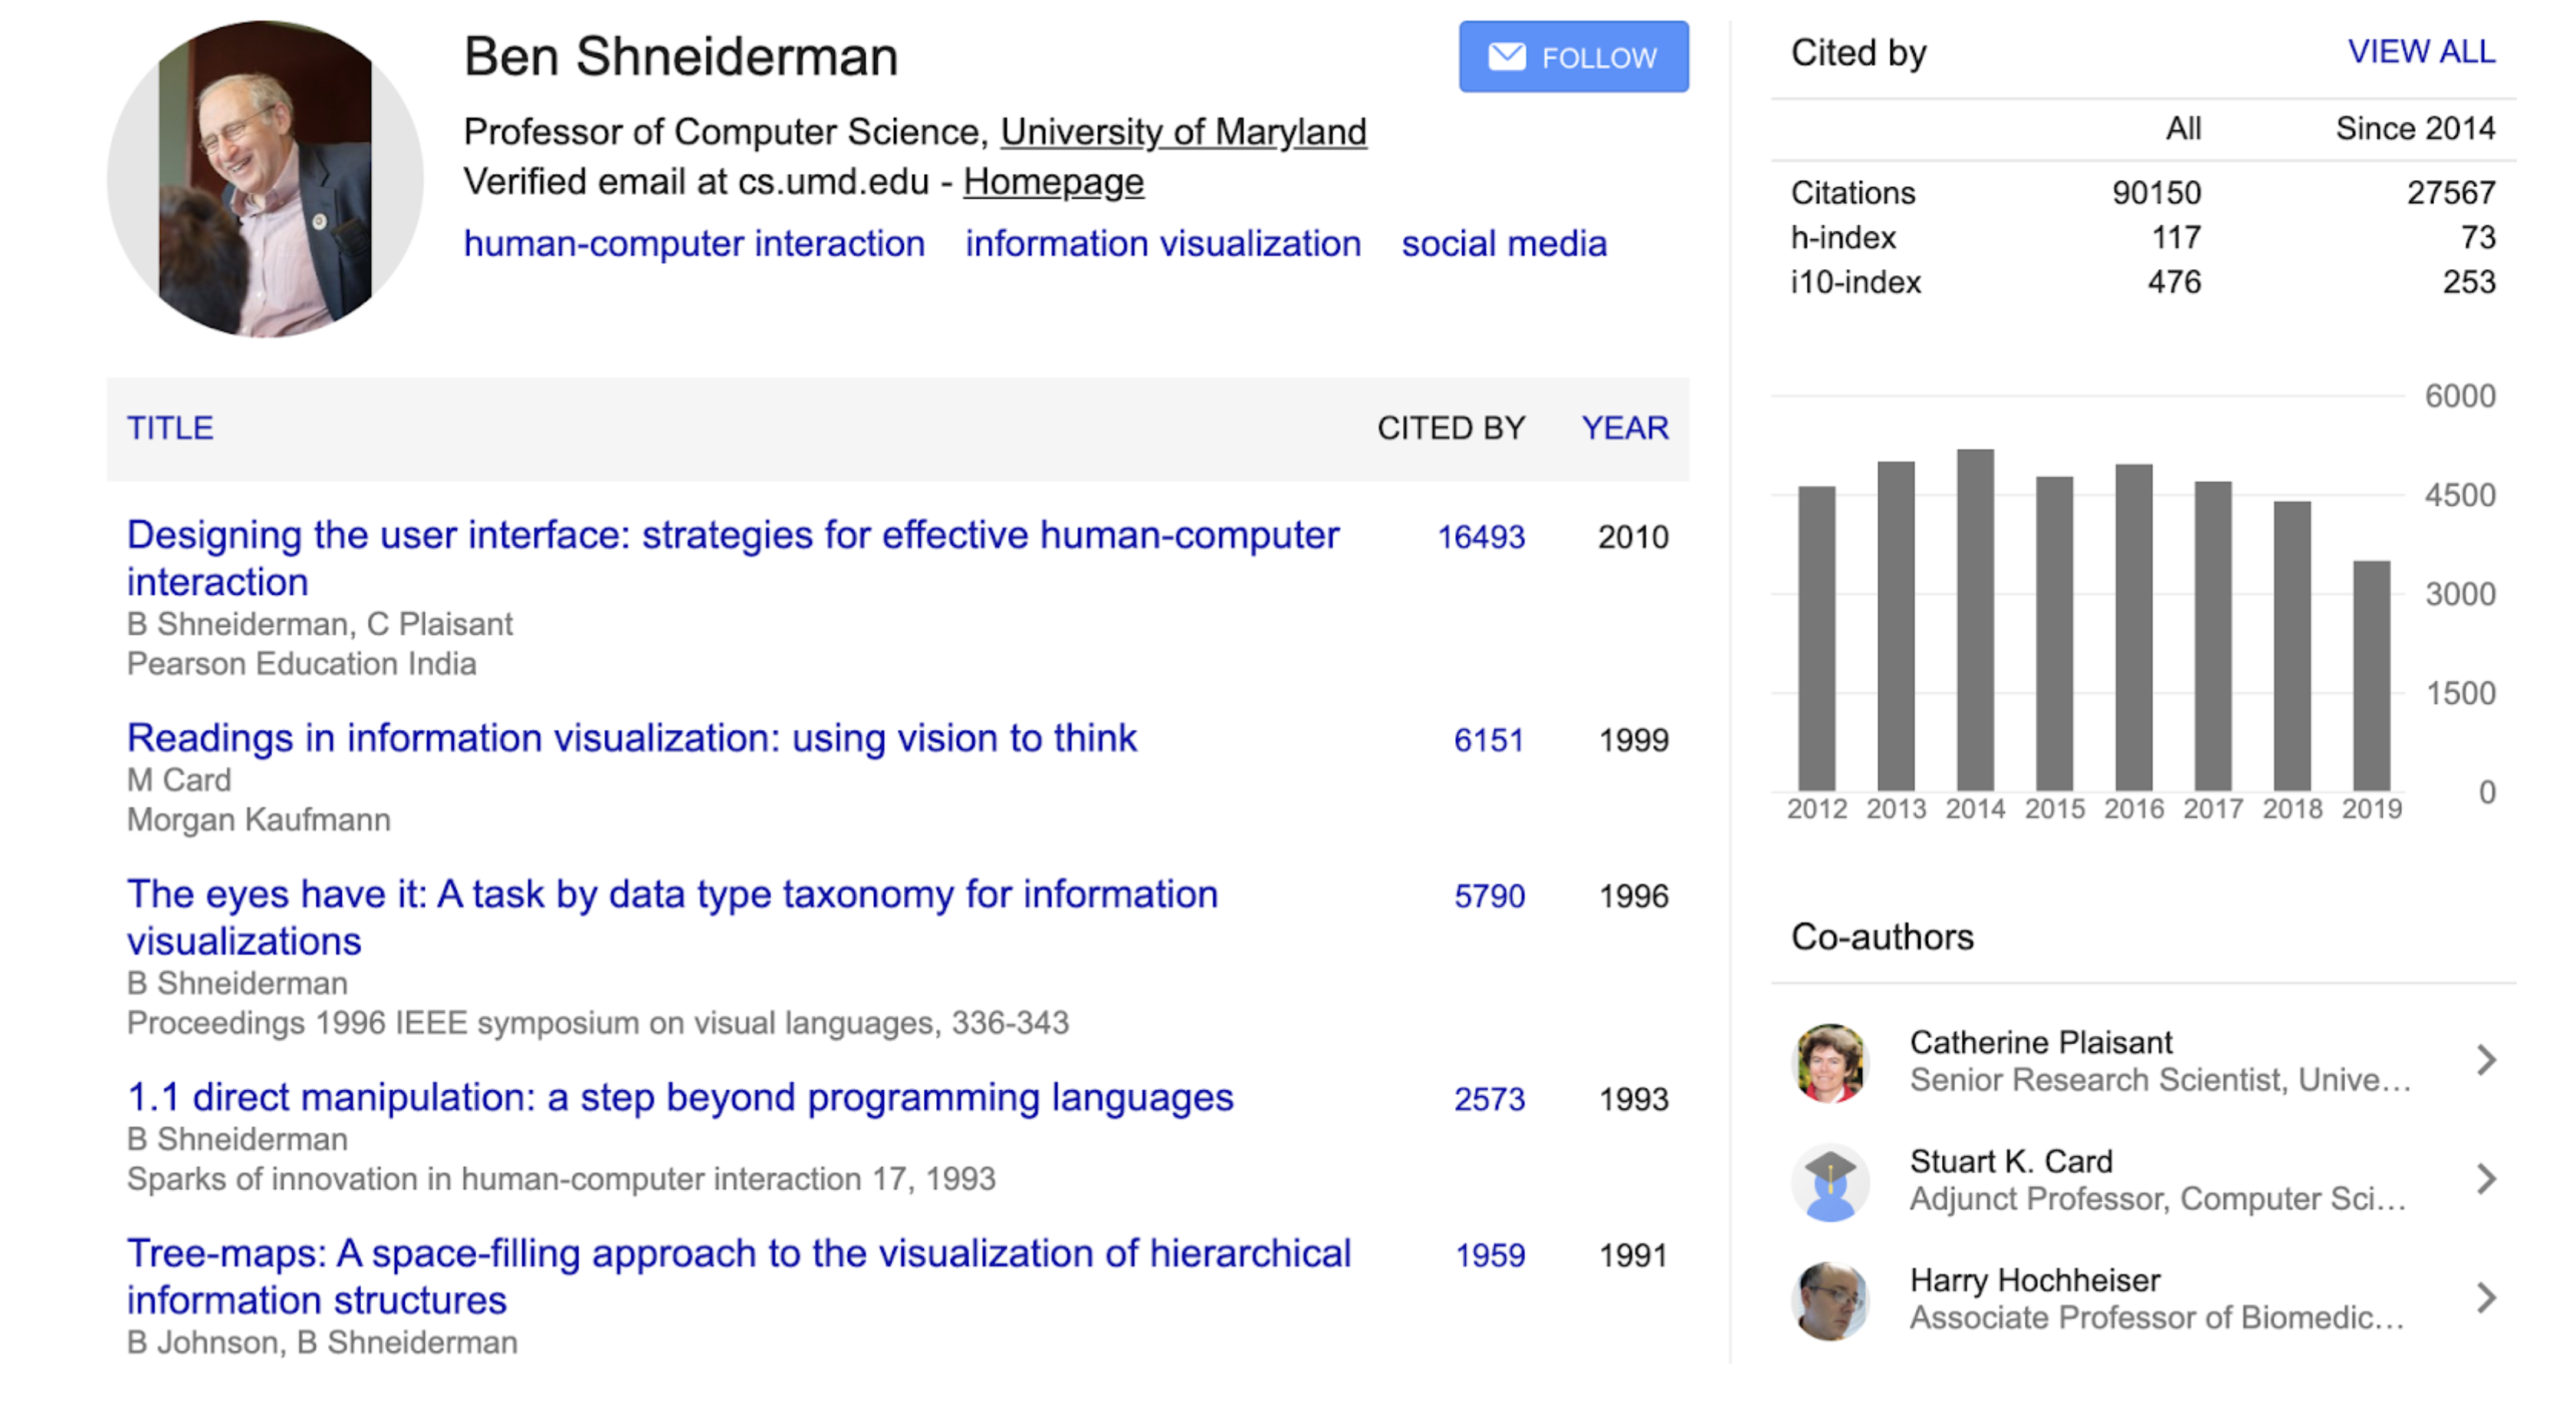
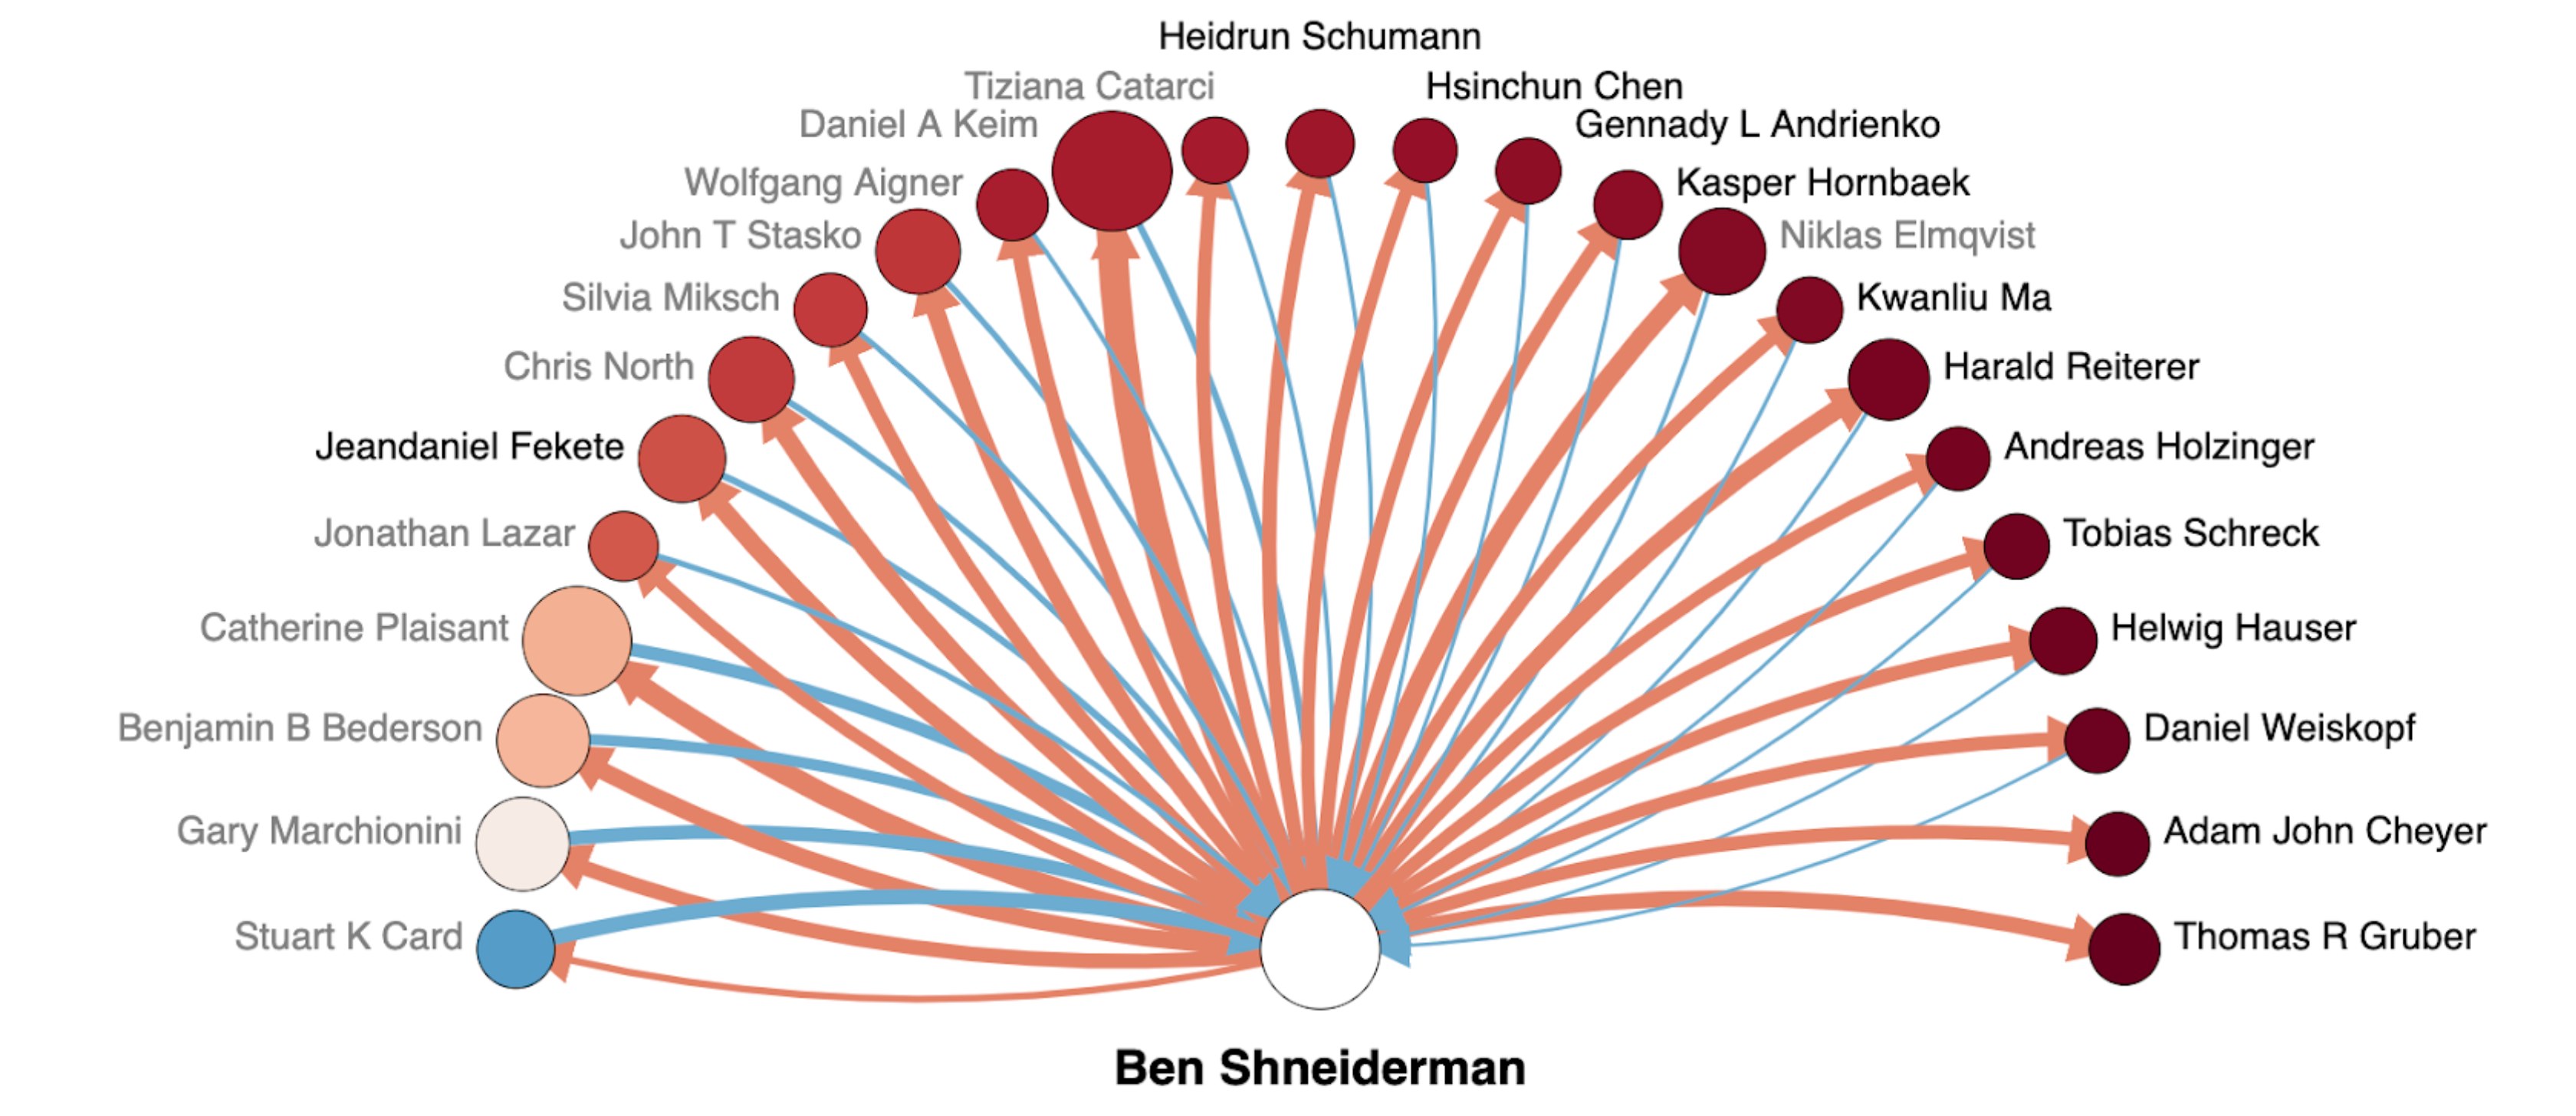
Figure 1 presents both the profile page and an Influence Flower of Ben Shneiderman. While the profile page is useful to quantify his impact by presenting a list of papers with the number of citation, productivity metrics, and his co-authors, the Influence Flower tries to answer a different set of questions: Who has influenced Ben Shneiderman in his early career and how does it change later? Who or which institution has cited him the most? Which fields are affected by him or which conferences/journals has he referenced the most? and how does the influence change over time?
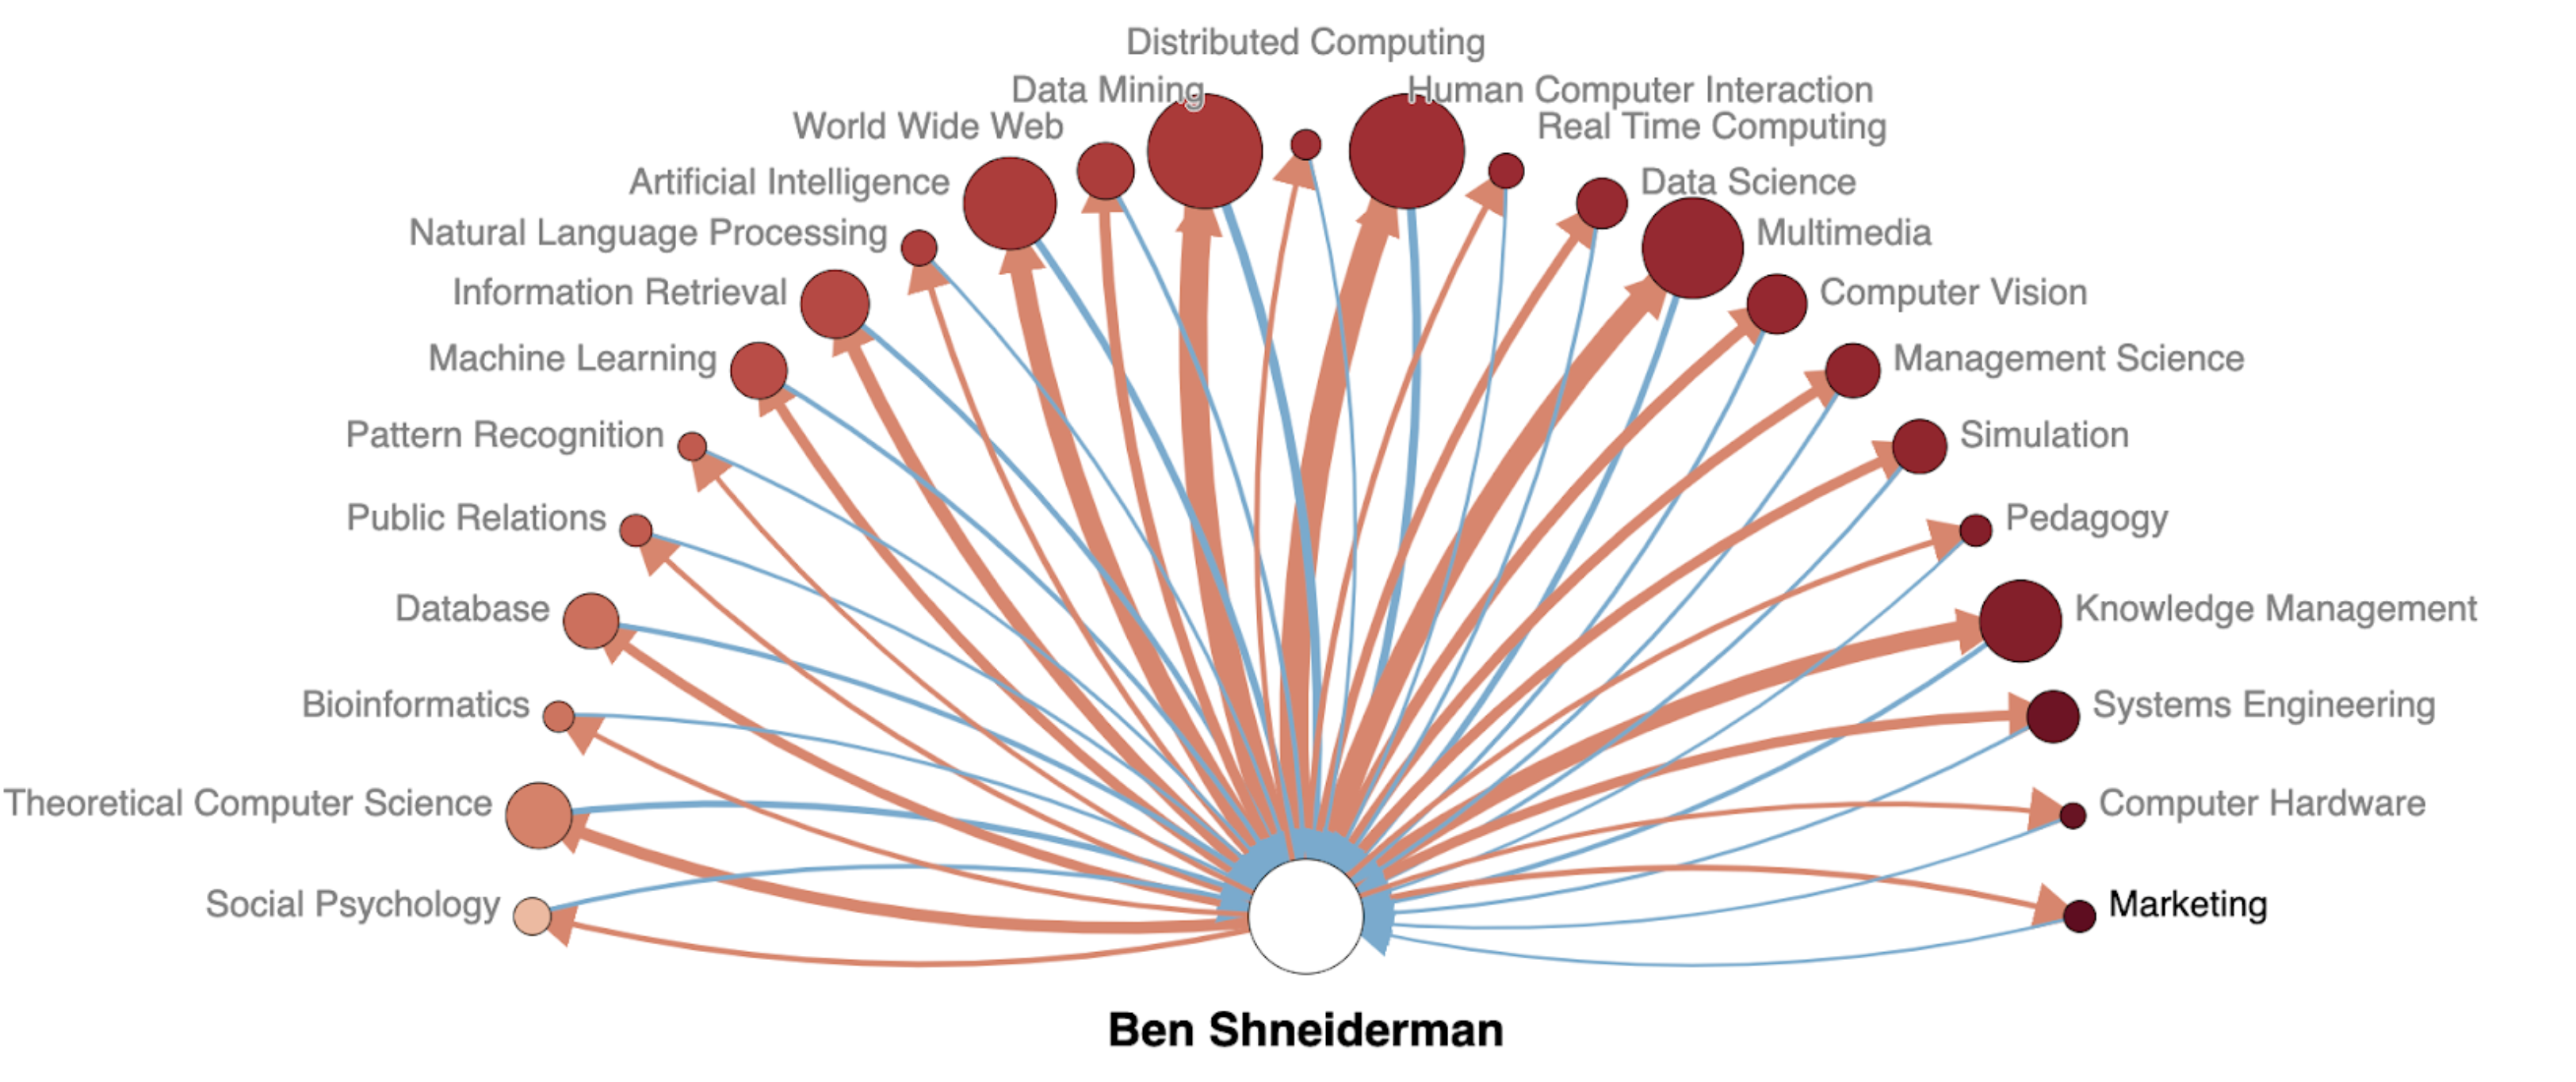
The author-to-author Influence Flower in Figure 1 shows Ben Shneiderman’s influence over his entire academic career. The alter nodes of the flower are 25 authors with the highest combined incoming and outgoing influence, ordered by node colour. Catherine Plaisant is the top co-author in the profile page, but the flower tells that Shneiderman has influenced her more than she has influenced him. Stuart K. Cart (the #2 co-author in the profile) is the most influential to Shneiderman (rank 1 by blue edge score). Daniel A. Keim is the author most influenced by Shneiderman (rank 1 by red edge score). 12 out of 25 authors in the flower have co-authored with Shneiderman (name in the grey font). Most of the authors in the black font have not co-authored with him but have mutual influence with him. Figure 2 shows the author-to-topic Influence Flower of Ben Shneiderman to represent the fields of research that have influenced him or have been affected by him.
Comparing Influence Flowers
To compare multiple Influence Flowers generated at different time periods, we created the concept of an anchor flower. The anchor flower is the reference against which an Influence Flower (the contrast flower) is compared. The anchor and contrast flowers share the same ego and alters in the same type. The time period of the anchor is always the superset of all contrast flowers – here the entire time range of the ego is used. The anchor is greyed out in the background, and a contrast flower is drawn in colour on top of the anchor flower. The node size and edge weight in a contrast flower are calculated by the relative influence score with the corresponding node and edge in the anchor. The colour of the node is decided by the contrast flower while keeping node order and position fixed by the anchor flower.
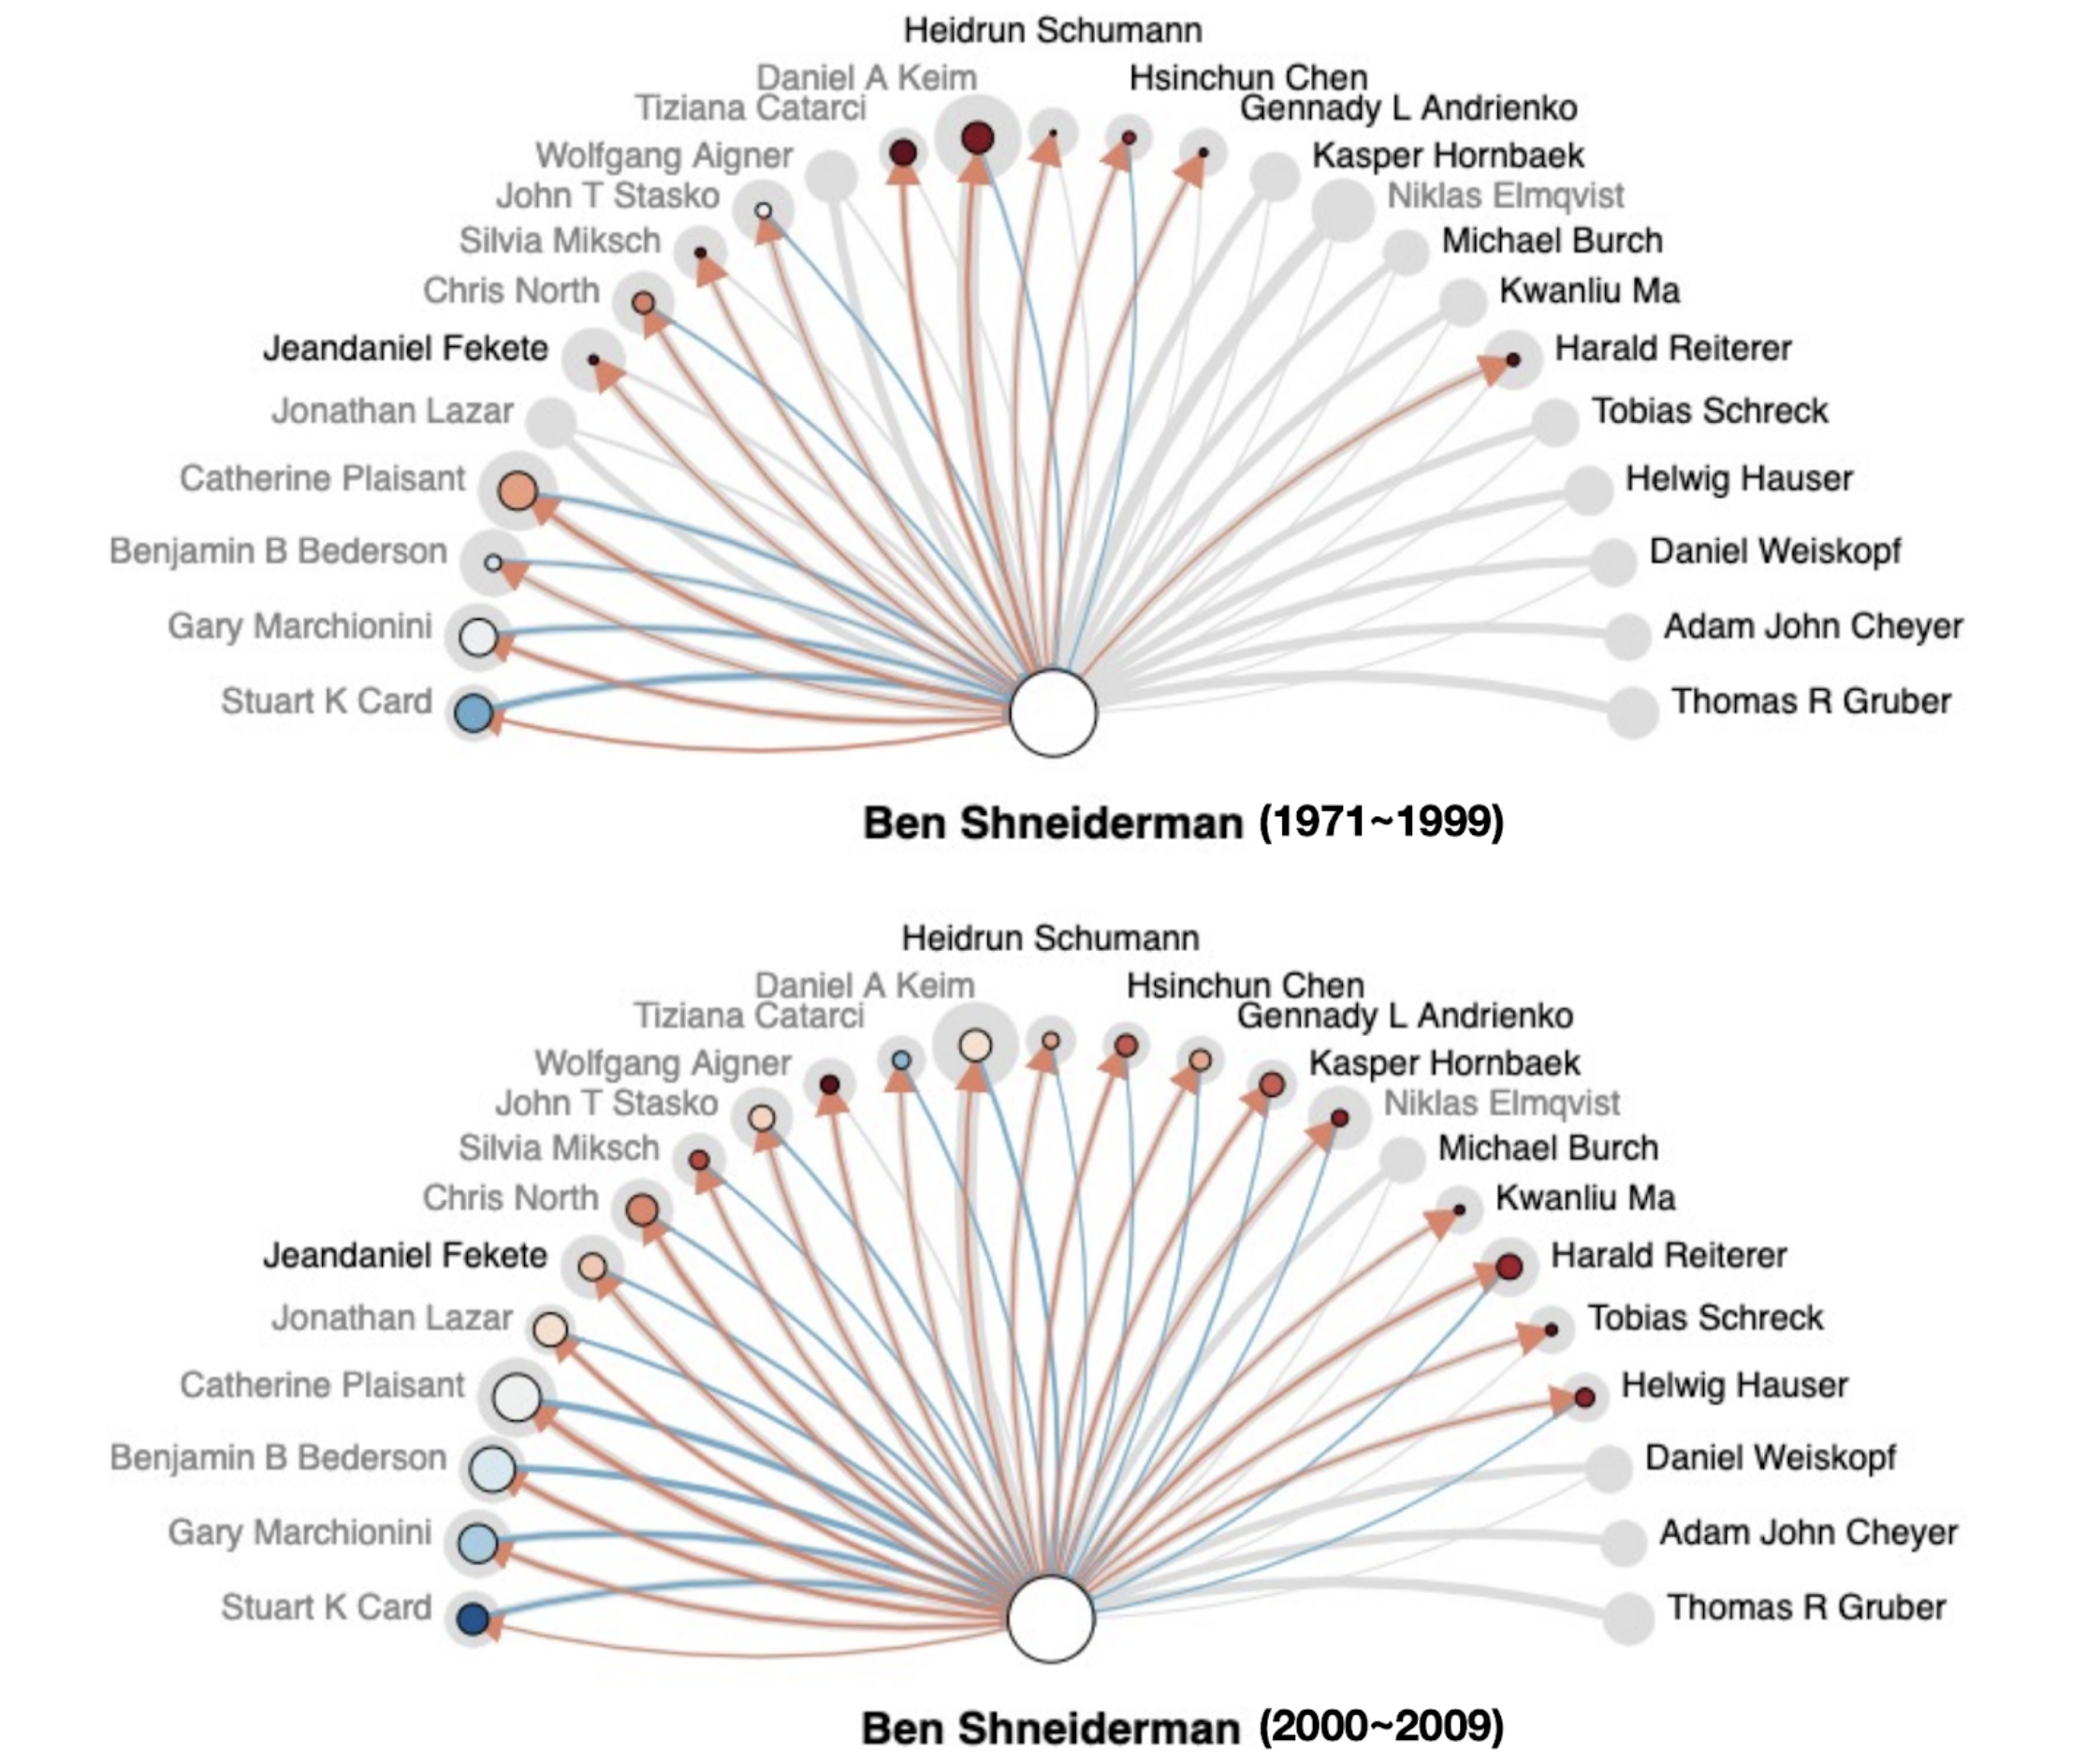
Figure 3 compares two snapshots of the author-to-author Influence Flowers of Ben Shneiderman. The anchor flower is created using his career publications and citations 1971-2018, greyed out as a background. The top flower is created using publications and citations from 1971 to 1999, the bottom flower using those from 2000 to 2009. Catherine Plaisant is the largest alter in both flowers. For Shneiderman, Plaisant bore more outgoing influence before 2000 (red), the influence almost equalised in the 2000s (white). One may also notice Niklas Elmqvist, whose mutual influence with Shneiderman was non-existent before 1999, began in the 2000s and mostly happened after 2009. This is corroborated by career information obtained from Elmqvist’s homepage – that his first paper was published after 1999, he started his faculty career between 2000 and 2009 (2008), and he joined the University of Maryland, where Shneiderman works, in 2014.
Data and System behind the Influence Flower

We use the Microsoft Academic Graph (MAG) dataset to compute influence statistics. MAG is the data source behind Microsoft Academic and is a large and openly available academic dataset covering all research fields. MAG is comprised of six types of academic entities and their relations – the current snapshot includes 176M scientific papers published from 1800 to 2019, containing 212M authors, 25K institutions, 52K publication venues (journal and conference series), 230K topics (e.g. from biology to genetics to CRISPR), and 1.2 billion citation relations. Entity types of paper, author, institution, journal, and conference are discovered from structured (e.g. publisher and knowledge base) and unstructured (e.g. web pages indexed by a search engine) sources. MAG provides entity resolution such as merging records from different sources, de-duplication, and disambiguation.
MAG dataset enables anyone to create an influence flower defined by the relations around a set of papers – this can be papers authored by oneself, papers from an institution, or papers produced by a particular project. We construct an interactive system Influence Map where the Influence Flower as the main visual element. Influence Map system is supported by efficient indexing and caching in the back-end. Users can search for any entity including authors, institutions, conferences, journals, papers, or aggregate a set of entities to form a project or a group. Sorting and filtering is possible with the Influence Flower. Users can change the year ranges or filtering options to compare snapshots of multiple Influence Flowers.
More than an Author
We note that the Influence Flower is not limited to authors, but to any academic entities that publish over time, including even a single paper. This work is described in the IEEEVIS 2019 publication: Influence Flowers of Academic Entities. In the paper, we present more case studies including: (1) presenting most influencing and influenced authors of a conference; (2) visualising a scientist’s career corroborated with biographic and interview records; (3) picturing the impact of a paper across disciplines (with delayed recognition); (4) profiling the intellectual footprint of a research institution; (5) mapping the topical trend changes in a conference; and (6) using the Influence Flower metaphor on non-academic data, by comparing the Twitter and academic influence profiles of a well-known researcher. Visit the project page to see the live system demos for these case studies. We also discuss how to compute and normalise the influence score in the paper.
Epilogue
I recently attended the IEEE VIS 2019 conference in Vancouver, Canada to present this work and it was actually my first visualisation conference. There were a lot of interesting and compelling talks as well as many well-known scholars whom I have only seen in the papers. After a couple of days wandering around, I fortunately had a chance to meet Ben Shneiderman to briefly introduce our work. He was very interested in his own influence flowers and said that he would come to my talk if possible. This selfie was taken after the conversation.

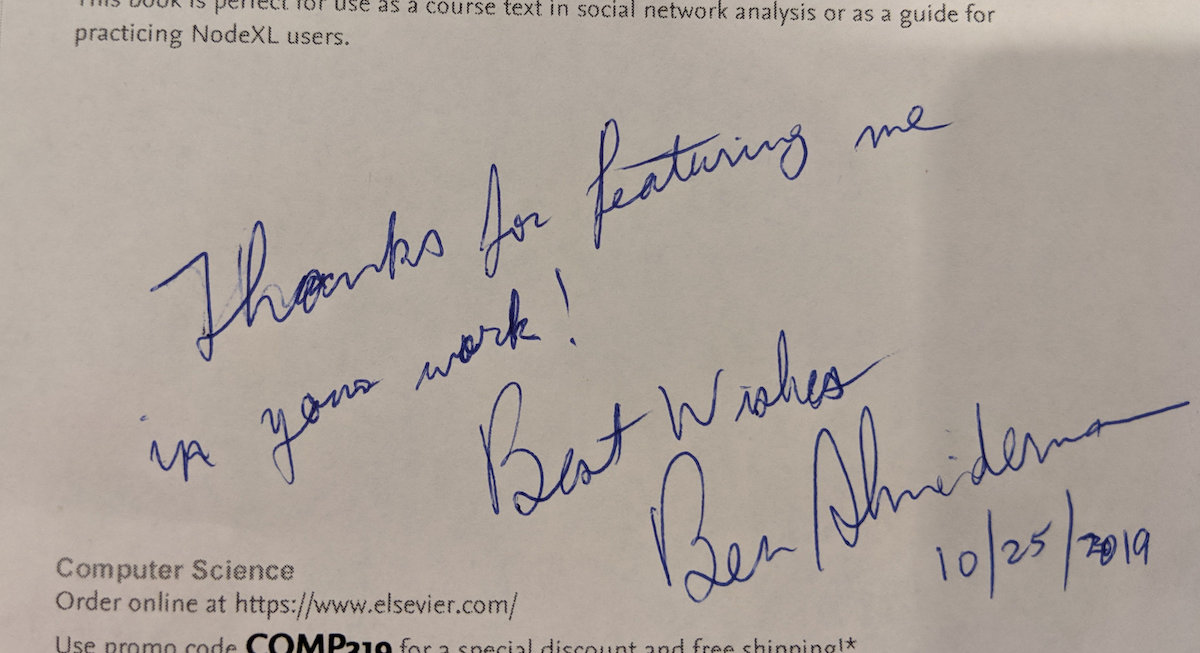
My talk was scheduled on the last day of the conference. To make matters worse, it rained heavily from the early morning. At the time of the talk, I noticed that it is not the biggest crowd as expected, however, I saw that Ben Shneiderman is sitting in the very first row. Although I was very nervous, my talk went fairly well with a few constructive questions and comments (Check out my talk here). After the session, by the way, Shneiderman came to me and gave me this note. What a surprise! It was such a wonderful present for using his career story without his consent :) I would like to take this article to thank him for making my first VIS conference very memorable.
Resources
Minjeong Shin, Alexander Soen, Benjamin T. Readshaw, Stephen M. Blackburn, Mitchell Whitelaw, Lexing Xie. Influence Flowers of Academic Entities, in the IEEE Conference on Visual Analytics Science & Technology (VAST) (IEEE VIS/VAST ‘19), Vancouver, Canada, 2019.
| Download: | Abstract | Paper+supplement PDF |
|---|---|
| Code | Project page | Github repository |
| Bibtex: |
@inproceedings{shin2019influence,
  title={Influence Flowers of Academic Entities},
  author={Minjeong Shin and Alexander Soen and Benjamin T. Readshaw and Stephen M. Blackburn and Mitchell Whitelaw and Lexing Xie},
  booktitle={IEEE Conference on Visual Analytics Science & Technology (VAST)}
  year={2019}
}