posted by Marian-Andrei Rizoiu , edited by Lexing Xie
One major gap in understanding social media is to precisely quantify the relationship between the popularity of an online item and the external promotions it receives. Our recent WWW'17 paper supplies the missing link. We use a mathematical model to describe the continuous interaction between external promotions (e.g. tweets about a video) and popularity dynamics (e.g. daily views). This in turn answers several practical questions:
- Can we explain the complex multi-phased popularity dynamics widely seen online?
- Can one predict what could become viral?
- Can one predict what would not become viral even if heavily promoted?
This post is the second of a series on modeling social media popularity using the Hawkes Intensity Process. “Expecting to be HIP (I)” presents a technical overview to a new method for computing expected event rate in unit time for point processes. “Expecting to be HIP (III)” further quantifies the effects and interpretations of promotion.
Why popularity?
Popularity is the novel currency of the online environment. It is a social phenomenon, a state of being liked, admired, or supported by many people. Popularity can be measured for an individual, a cultural item (like a book and a movie), a physical item, or a virtual entity that exist online (like a trending hashtag). Popularity captures people’s attention, it is directly linked to political outcomes, monetary awards and various notions of fame. However, predicting what will become popular is notoriously difficult, given a series of social phenomena that we are just starting to understand (such as perceptual biases, the limited amount of available human attention or randomly occurring external events which direct the human attention towards certain items). Better understanding of popularity and its dynamics over time is at the heart of understanding contemporary political and civil events, from grassroots movements such as Arab Springs and the Occupy movement, to actively promoting issues such as climate change and global public health.
<img src="/img/expecting_to_be_HIP/fit1.png" width="250" Hspace="15" Vspace="10" style="display: table-row; float: right;" >
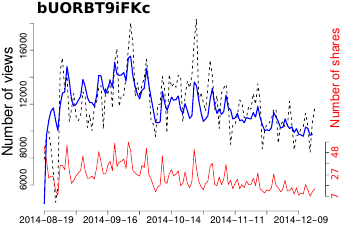
<figcaption style="display: table-row;">Fig.1: The popularity series of two videos, explained by HIP: <a href="https://www.youtube.com/watch?v=bUORBT9iFKc">bUORBT9iFKc</a> is a music video and <a href="https://www.youtube.com/watch?v=WKJoBeeSWhc">WKJoBeeSWhc</a> is a news video.</figcaption>
Modeling popularity with HIP
While it may turn out impossible to accurately predict what will be highly popular in the future (in other words, what will become viral), we can already do the next best thing: we can identify what has the potential of becoming viral given enough attention by precisely quantifying the relationship between the popularity of an online item and the external promotions it receives. Our work recently presented at WWW'17 supplies the missing link between exogenous inputs from public social media platforms, such as Twitter, and endogenous responses within the content platform, such as YouTube. We developed a novel mathematical model HIP (short for Hawkes Intensity Processes), which can explain the complex popularity history of each video according to its type of content, network of diffusion, and sensitivity to promotion. HIP is based on a novel method for computing the expected event rate in unit time for point processes, called the Hawkes intensity and which was already detailed in the post “Expecting to be HIP (I)”. As shown in Fig.1, HIP is capable of explaining complex popularity dynamics by constructing a tight fit between observed popularity (black dashed curve) and the fitted popularity (blue curve), given the series of exogenous inputs (red curve).
Explaining popularity dynamics
<img src="/img/expecting_to_be_HIP/colormaps-film_animation.png" width="500" Hspace="15" Vspace="10" style="display: table-row; max-width: 450px;" >
<figcaption style="display: table-row;"></figcaption>

<img src="/img/expecting_to_be_HIP/colormaps-Gaming.png" width="500" Hspace="15" Vspace="10" style="display: table-row; float: right;" >
<figcaption style="display: table-row;">Fig.2: Density plot for all (left) vs the most popular 5% (right) Gaming videos. Popular Film & Animation videos tend to
have a higher exogenous sensitivity, while those for Gaming have mainly a higher endogenous response.
Our model supplies a prototypical description of videos, called the endo-exo map. This map explains popularity as the result of an extrinsic factor – the amount of promotions from the outside world that the video receives, acting upon two intrinsic factors – and inherent virality on the X axis, and sensitivity to promotion on the Y axis. Fig.2 compares the plots for the videos in two Youtube categories: Film & Animation (top row) and Gaming (bottom row). The left graphic show, for each category, the density plot of all the videos, while the right plot shows the density plot of the top 5% most popular videos in each of these two categories. Visibly, while most popular videos in Film & Animation are described by higher exogenous sensitivity (shifting upwards), the most popular Gaming videos have higher endogenous response – their density mass is shifted to the right of the endo-exo map.
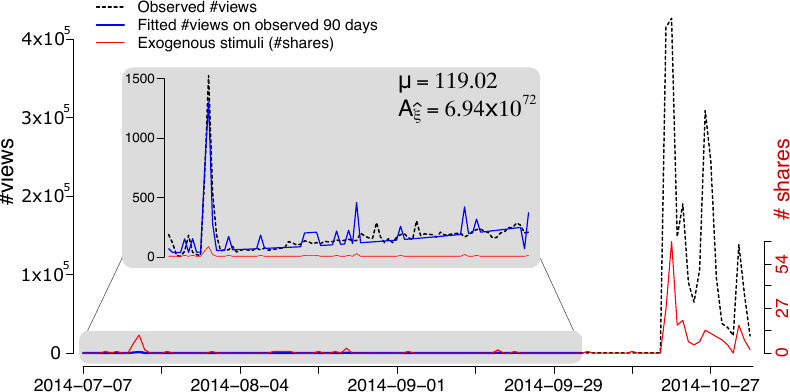
Identifying potentially viral items? The endo-exo map can be used when deciding between which videos to promote in an advertisement context. Furthermore, it can be used to identify a particular class of videos: those that have a high potential to become viral, but are yet to do so. Fig.3 shows an example of such a potentially viral video, which received virtually no attention during its first three months of live, only go viral during the forth month. When studying the fitted HIP parameters for this video, we observe that HIP deemed it as highly viral, by studying its popularity dynamics during the first three months (shown in the inset - before going viral).
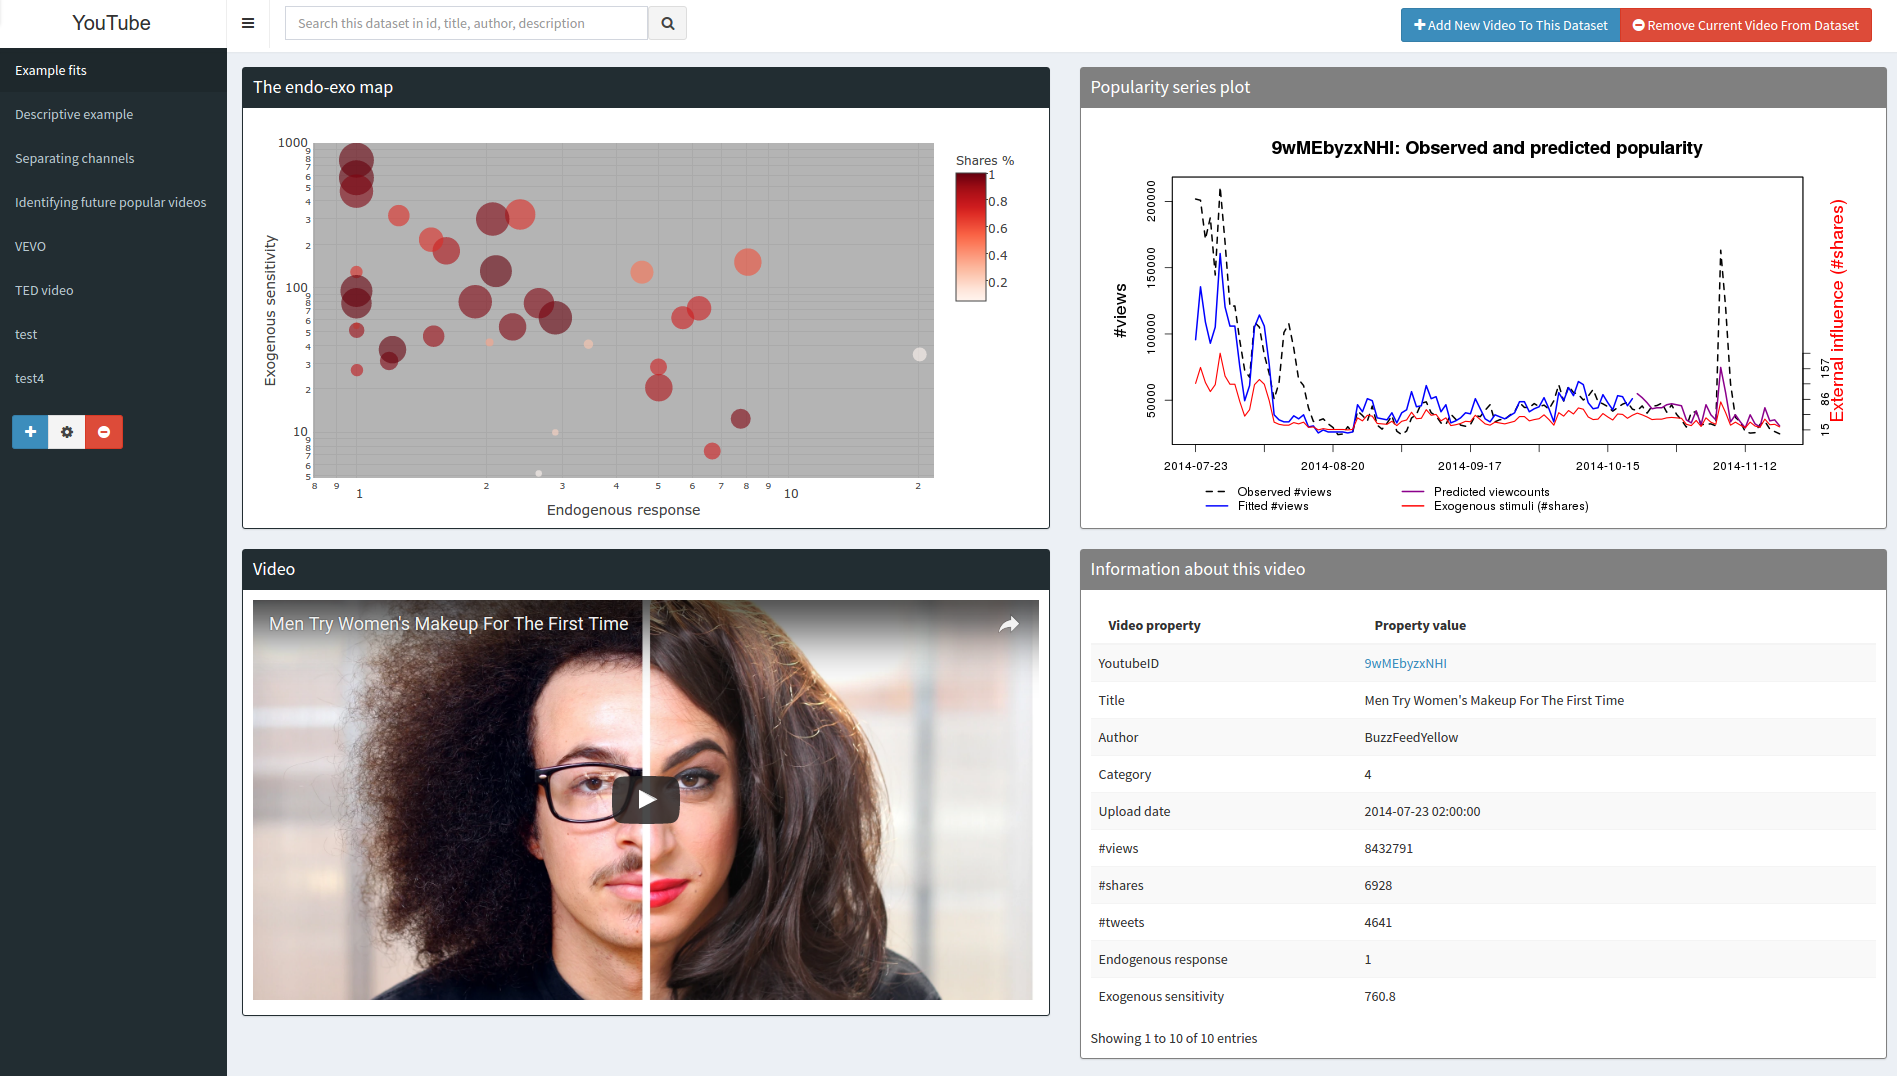
Try it yourself
We built an interactive visualizer for HIP, applied to Youtube videos. It allows you to create your own video collections, by adding your favorite videos, visualizing them on the endo-exo map, alonside with the observed and fitted popularity series and video metadata. Or simply explore one of the default visualizations, including TED videos and VEVO artists.
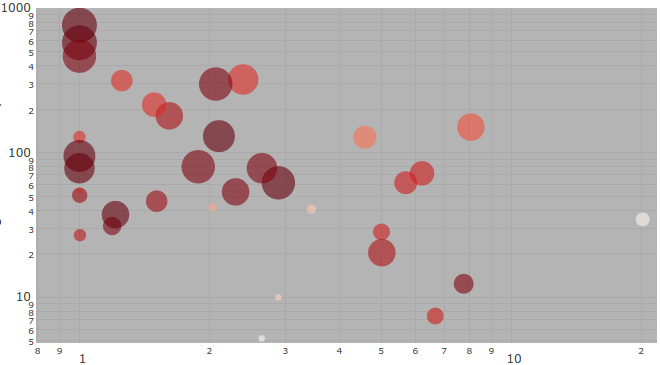
The endo-exo map in the visualizer shows videos individually: each disc is a video, the diameter of the disc is proportional to videos popularity, and the color intensity of the disc is proportional to the amount of promotion each video has received. The map allows to analyze videos comparatively: the more a video is to the right, the higher its inherent virality; the more a video is to the top, the higher its sensitivity to external promotions. This relation can be visually observed in the “Example fits” visualization of the demo (also shown in the thumbnail below): videos with more privileged positions on the map acquire higher popularities (larger discs) with less external promotion (lighter colors).
If you want to try out on your own data, we have released code and tutorials for fitting HIP and explaining popularity dynamics.
[
Resources
Marian-Andrei Rizoiu, Lexing Xie, Scott Sanner, Manuel Cebrian, Honglin Yu and Pascal Van Hentenryck. Expecting to be HIP: Hawkes Intensity Processes for Social Media Popularity, in Proceedings International Conference on World Wide Web (WWW ‘17), pp. 735-744, Perth, Australia, 2017.
| Download: | Paper PDF + SI Talk slides |
| Data & code: | Github repository |
| Bibtex: |
@inproceedings{Rizoiu2017,
    address = {Perth, Australia},
    author = {Rizoiu, Marian-Andrei and Xie, Lexing and Sanner, Scott and Cebrian, Manuel and Yu, Honglin and {Van Hentenryck}, Pascal},
    booktitle = {World Wide Web 2017, International Conference on},
    pages = {735--744},
    title = {Expecting to be {HIP}: Hawkes Intensity Processes for Social Media Popularity},
    year = {2017},
    doi = {10.1145/3038912.3052650},
    isbn = {9781450349130},
}