posted by Lexing Xie

The icons above are:
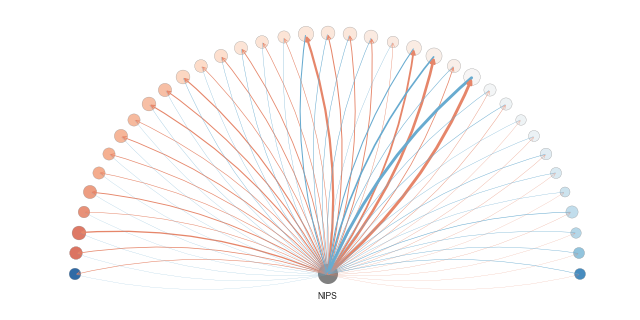
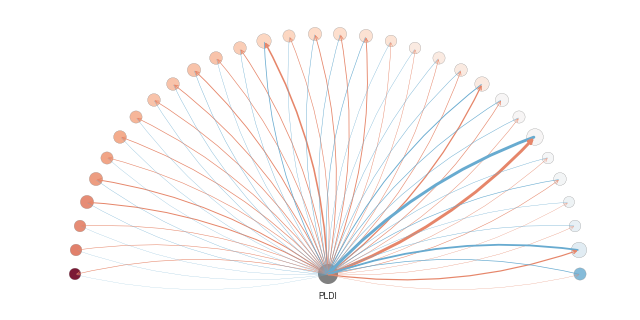
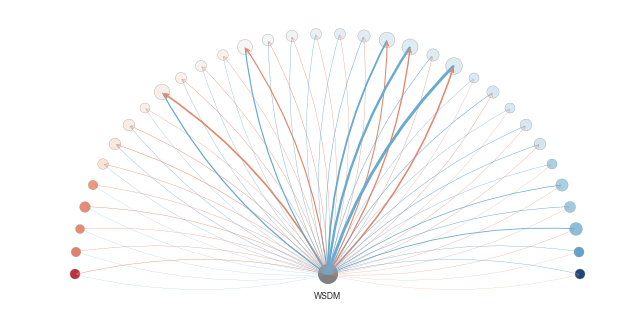
Citation flow: The colored half-wheels above summarizes the overall amount of citation between a conference in question (gray node in the center) and the top 25 other conferences or journals that cites or are cited by this venue. Left to right: NIPS in machine learning, PLDI on programming language design and implementation, and WSDM on web search and data mining. Click on individual conferences above or goto the citation flow summary page for details.
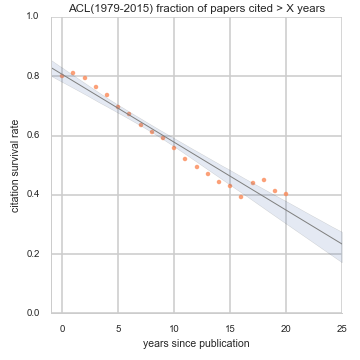
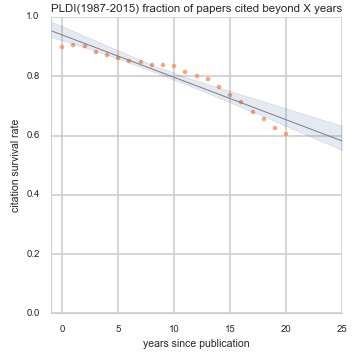
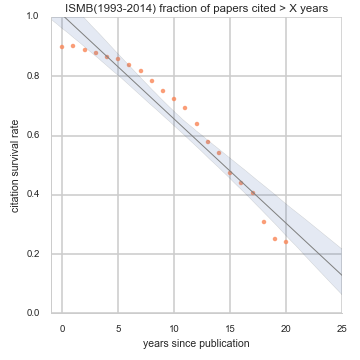
Citation survival: The orange dots fitted with a linear trend are the citation survival rates, i.e. fraction of papers from a conference that are cited at least once X years or more after publication. This plot and its name was coined and first implemented for ACL by Jacob Eisenstein. Left to right: ACL in natrual language processing, PLDI on programming language design and implementation, ISMB in computational biology. Click on individual conferences above or goto the citation survival summary page for details.
The motivation, method, and implications are explained below. Detailed plots are also accessible from list of all conferences.
Why is this worth looking at
- Where are the intellectual influences of a conference coming from, and going to? If you have been publishing in, and going to conference(s) for a while, or if you are about to enter a community formed researchers around a conference, you may wonder what this community’s intellectual heritage is.
- How many papers are remembered in the collective memory of the academic community? for how long? Or, as a heated post-conference beer conversation has it: are 80% of the papers forgotten in 2 years? Spoiler alert: no, for most conferences we looked at; but about 20% tend not be cited at all.
- Do citation behaviors change over the years? Spoiler alert: yes they do, particularly right after 2005 or 2006, and we could probably name it the ‘scholar search effect’.
These are the motivating questions that started this study. An aha-moment came when I saw the dataset that can answer them.
Data and method
Our data source is Microsoft Academic Graph (MAG), in particular, the version released on 2016-02-05. In particular, we group papers by venue, and map out the incoming and outgoing citations for all papers in a given venue known to MAG. The analysis was mostly conducted from late 2015 to 2016. The code for data crunching, plotting and report generation are shared in this repository.
Observations
- The fraction of papers that are cited at all (i.e. at least once >=0 years after publication) in most conferences tend to be around 80%. See for example, SIGMOD, SIGIR, NIPS. Exceptions include SIGGRAPH at 47% or CRYPTO at 89%.
- The fraction of papers that are cited 20 years or beyond varies, from 10%, 20%, to 40%, … 60%. This statistic highly depend on the history of the conference in question – most conferences has just a bit more than 20 years of history – and the number of papers published at least 20 years ago (i.e. before 1995) are quite small. One extrem case is ISIT, with 2 papers in 1973, and then the next year with any paper available was 1991.
- The long-tail of collective academic memory: Most conferences tend to have 60-70+% of both incoming and outgoing citations from the top 25 venues, but the total number of venues of both references and citations tend to be in the 1000s or 2000s.
- The scholar search effect. there are more references made to older papers after 2005 or 2006. This is likely due to the fact that finding older papers has become easier as search engines for scholarly literature become easier. We can see this effect from the outliers in Fig 8 of each conference page, for example, ACL, SIGIR, ICML, and many others. Exceptions to this include EUROCRYPT, for which the reference memory seem to remain unchanged. This is likely due to the smaller number of EUROCRYPT papers (in this dataset) over the recent few years – do anyone know if this is indeed the case?
FAQ and Disclaimer
- Can you add conference X, how long does it take? Sure, drop me a line. Exporting data for a conference from the MAG typically takes less than 1 hour, and computing stats and plotting takes a few minutes.
- Where is conference X? The list of conferences and their grouping is arbitrary based on the biased and limited knowledge of the author, drop me a line or leave a comment if you’d like to see one or more particular conference included. See the last question.
- Why there is conference X but not Y? We encountered some bugs for some conferences (e.g. AAAI), we intend to add them as bug fixes go along.
- Statistics on the plot are based on counting citations individually, it could be skewed by one or a few highly cited paper(s), especially for small venues.
- The paper counts (and hence citation and references per paper) include not just technical papers but also other items such as demos, abstracts for keynote talks, this may skew the average statistics of the reference and citation counts.
So what?
- A few pictures may be worth a thousand words. I hope this gives useful insights for your conference, get to know a new conference, or it may be useful to help you present the profile and impact of a conference.
- Could this become an alternative impact metric? Maybe. There are many metrics, some are widely used, such as this, this, or these. No metric is perfect, and having another view could certainly be useful.
- A low-dimentional similarity space of venues, or this could lead to ‘another map of science’.
Happy to hear feedback or ideas – leave a comment below, or let me know!
Backmatter
- Material on this page and associated detail pages are licenced under creative commons Attribution-NonCommercial 4.0 International license: BY-NC-4.0
- This is a work in progress. Comments and suggestion welcome. I am also happy to hear if you use this in some way.
- I thank Jacob Eisenstein for very informative discussions, and especially the idea and sample code for citation survival rate over years.
- Thanks also go to Richard Nock for inspiring discussions.