posted by Lexing Xie
We analyzed some data available from microsoft academic graph, in order to quantify the scientific heritage and citation impact over the first 8 years of the WSDM conference – taking place this week in San Francisco! Here are some preliminary observations.
Volumes of papers, reference and citations
We first plot (left figure below) the number of WSDM papers per year from 2008 to 2015, a total of 531 entries recognized by the Microsoft Academic Graph – called MAG hereafter. We can see that the number of published papers rose during 2011-2013, and decreased in 2014 and 2015. ACM digital library shows that WSDM 2011 has 83 technical papers and WSDM 2015 accepted 39 technical papers, while the number of ACM DL entries is 64. Showing that the number of entries in the dataset seems higher than the actual number of technical papers, possibly including tutorials, keynote abstracts, and others writeups.
On the right we plot the average number of references for WSDM papers published in each year (in red), and the number of citations received for WSDM papers published in each year (in blue). We can see that the average number of references (between 10 and 25) seem lower than that of a typical technical paper – this is reasonable given the inclusion of talk abstracts and other shorter writeups.
More notably, the average number of citations received for WSDM 2008 papers were over 80 – this is high give the short history of the conference. WSDM 2011 papers has an average of 50 citations, while those from the subsquent conferences are still on catching up given the short timeframe since publication.

The left figure below shows the volume of citations to WSDM papers, a total of 9,771 citations broken down by the year WSDM paper were published in. In MAG, 4,813 of these citation entries do not have a recognized publication venue name – either a conference or a journal. Among the remaining 4,958 entries, WSDM 2008 and 2009 receive citations from over 300 venues, while 2010 and 2011 were cited by more than 200 venues (right figure).

Lastly, we profile the references made in WSDM papers, a total of 11,334 entries. In MAG, 3,014 of these references do not have a recognized venue name. Among the remaining 8,320, WSDM papers of each year refers to between 150 and 250 different venues (right figure).

Where are the citations coming from
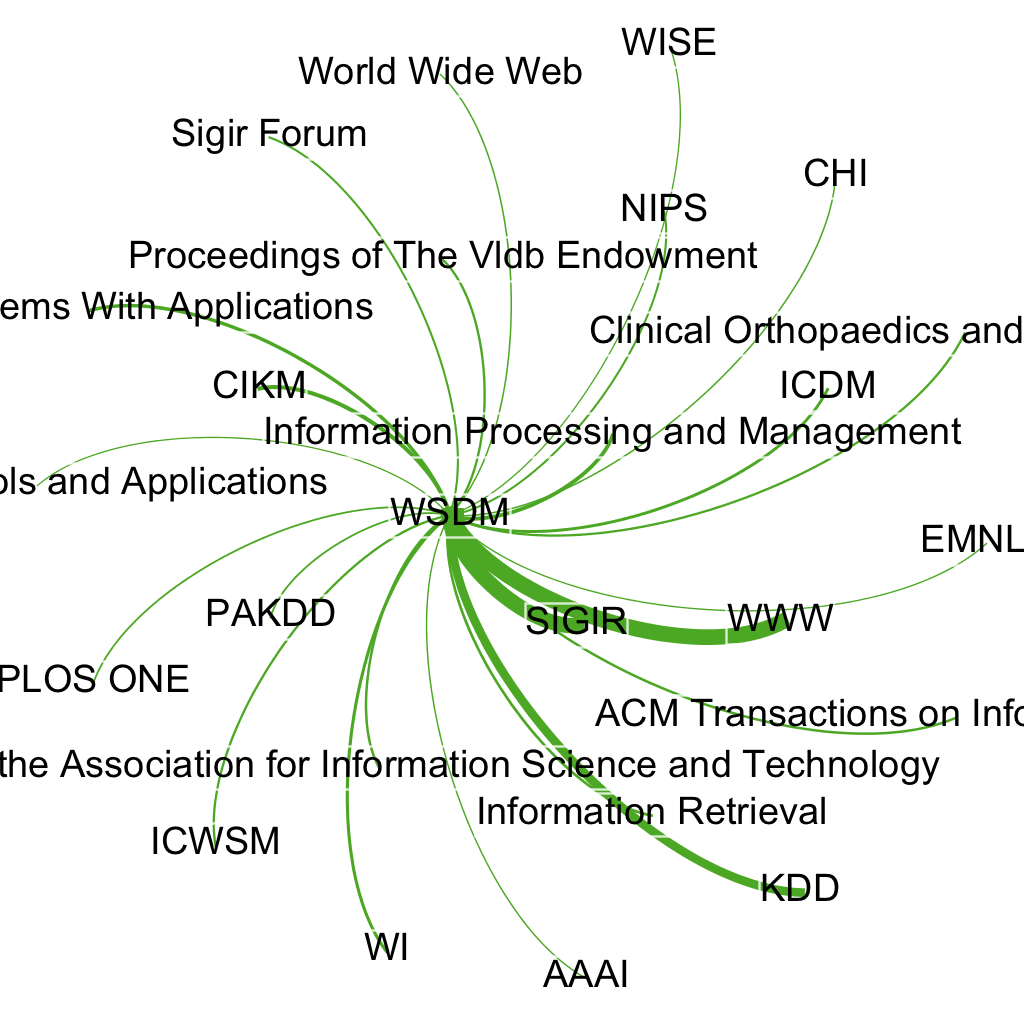
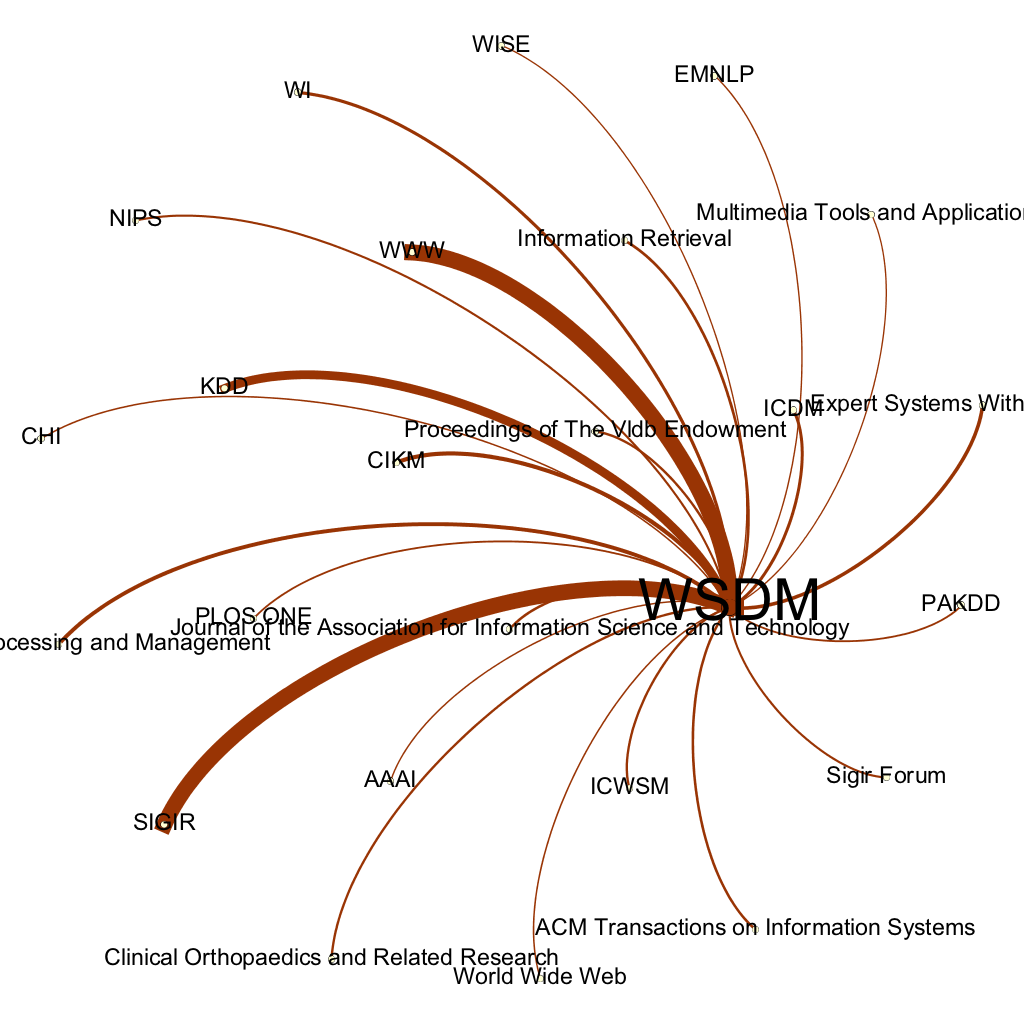
We profile the 710 known venues that cite WSDM papers. The directed graph below shows the top 25 venues by the number of citations made – with papers from the WWW conference citing WSDM papers 399 times, SIGIR a close second with 391 citations, followed by WDSM itself, KDD, and CIKM. Further down the list was a number of journals, e.g. Information Processing and Management, Expert Systems With Applications, similar conferences in data mining (ICDM), web (WI) and social media (ICWSM).

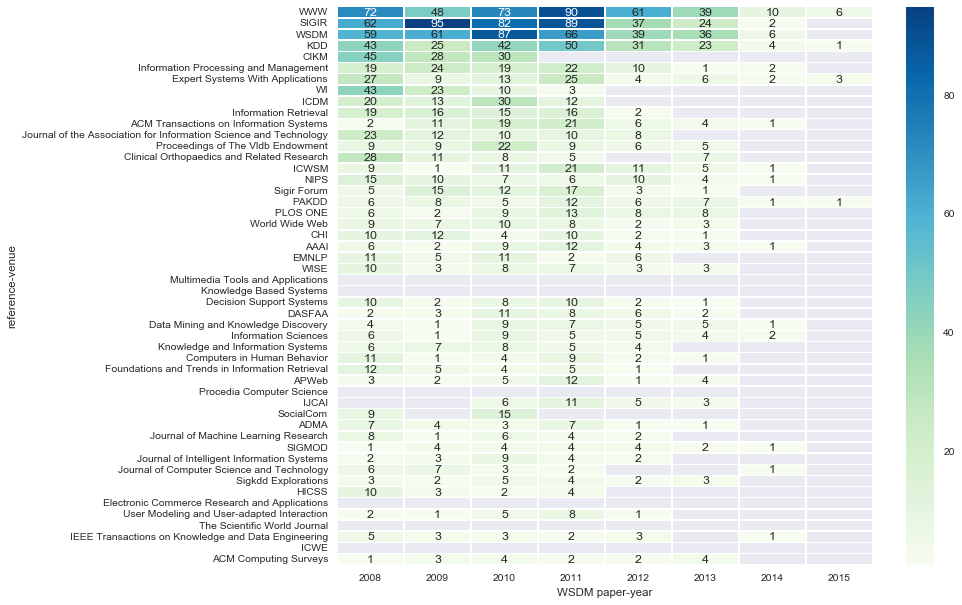
The heatmap below shows the citation patterns over different years (of WSDM paper that are being cited) for the top 50 venues. We can see a more diverse set of venues that were influenced by WSDM, from library sciences, database, AI, NLP and machine learning.
Where are the references going to
We profile the references that WSDM publications make, broken down by venue. The graph shows the top 25 venues that WSDM papers cite, starting from SIGIR, WWW, KDD, and WSDM itself, including CIKM, machine learning conferences NIPS and ICML as well as other venues in social media, natural language processing, databases, to name a few.
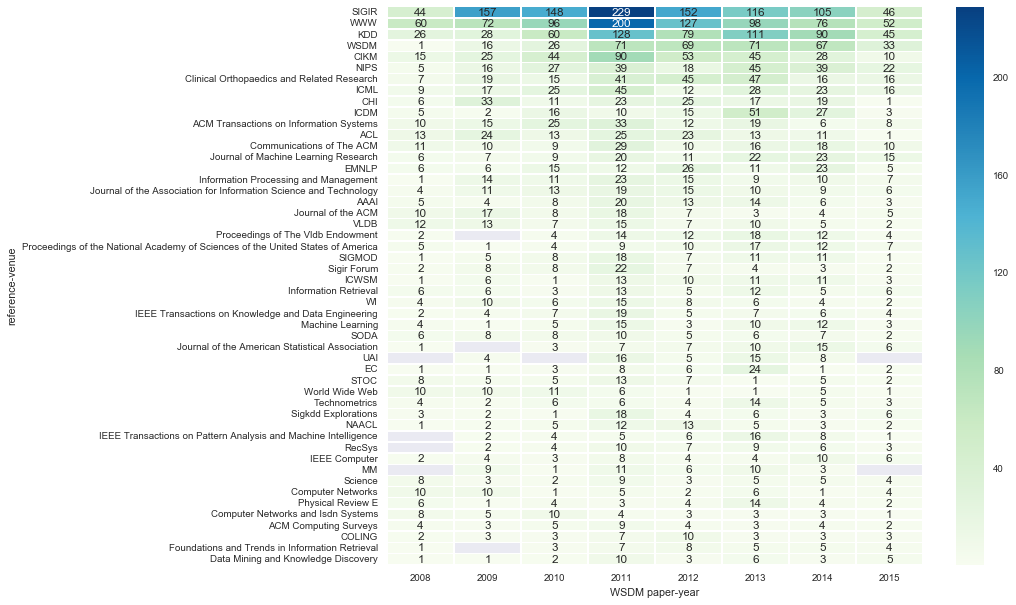
The breakdown of reference venues by year is informative. It seems that WSDM papers overall is diversifying from the scientific heritage of web (WWW) and search (SIGIR), and draws from a more diverse set of venues.
The entry about “Clinical Orthopaedics and Related Research” is quite curious, possible data error?

### How long is the "collective memory" of WSDM papers
Besides breaking down by venue, we also looked at breakdown of references by year. The earliest references that WSDM papers make dates back to 1903, while the majority of citations are within the last 10 years.
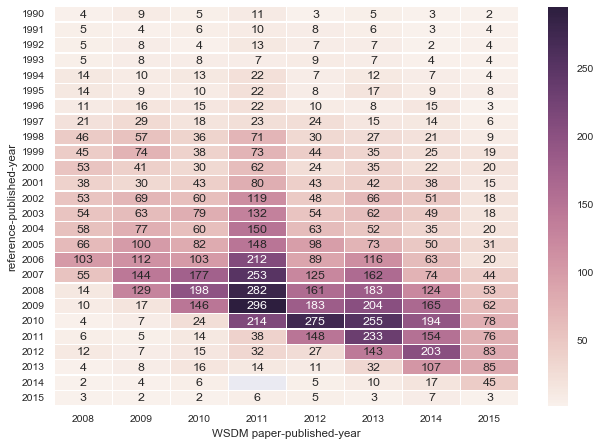
Here is a breakdown of citations by year. Besides showing that WSDM papers in the past 2-3 years are yet to receive more citation, this graph also exposes possible data issues – with a non-trivial number of citing articles published earlier than the articles they cite!
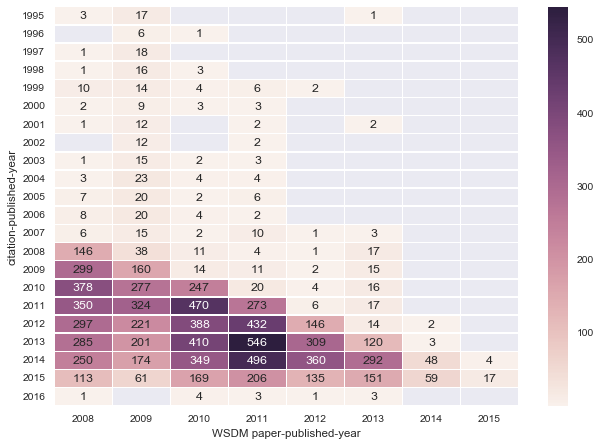
We note that the data availalbe on Academic Search about WSDM can be noisy and incomplete. Any inaccuracy in data analysis and presentation are the responsibility of the author. The code and ipython notebooks used for slicing the MAG and plotting is on github.