
- 12 years of publication 2004–2015, 442 papers total
- 7418 references total, average 16.78 per paper
- 505 reference venues, 74.0% in top 25
- 16214 citations total, average 36.68 per paper
- 876 citations venues, 63.0% in top 25
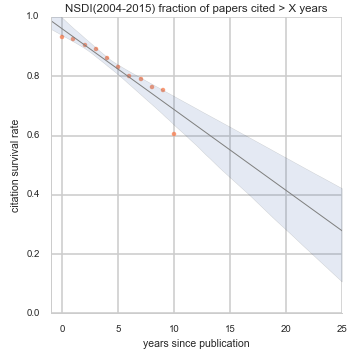
- citation survival rates: 0yr 0.93; 10yr 0.61; 20yr nan
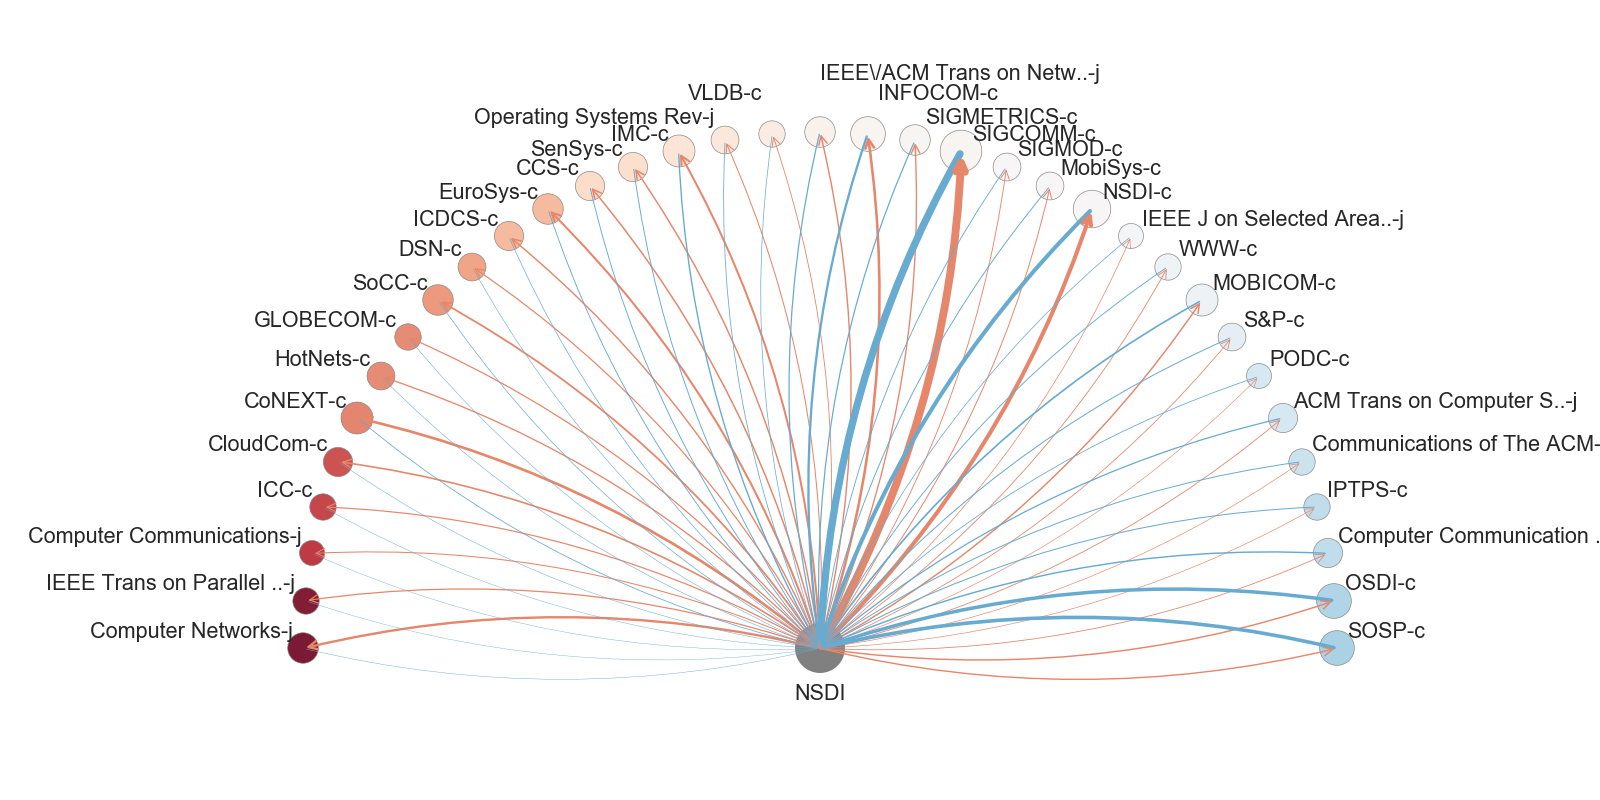
The half-wheel on the left is a snapshot of the top venues that cites and cited by this venue (details in Figure 4 below). The survival graph on the right contains the fraction of papers cited at least X years after being published (details in Figure 10 below).
The plots on the rest of this page roughly breaks down into the following types.
- Figure 1 - Figure 3 contains basic stats of papers, references and citations over its lifetime.
- Figure 4 and 5 summarizes the incoming and outgoing citations over all years, sorted by the ratio of incoming over outgoing citations (left to right).
- Figure 5 and 6 breaks down the incoming and outgoing citations by year of the conference paper.
- Figure 7 and 8 breaks down the outgoing references by the year they were cited in this conference. For most conferences we can see a ‘google scholar’ effect that older papers gets cited more (and from more venues) in recent years, likely due to the ease of finding them.
- Figure 9-11 explores the question “how many papers are still cited at least after X years”, and what fraction of papers are not cited at all.
Note: This page visualizes reference and citation patterns of one conference, generated from templates. For a written overview of the visualization series, and background about problem, motivation and methods please see the overview page. Also of interest are the overview page for citation flow or the overview page for citation survival rates.
Larger version of any figure can be obtained by clicking the figure.
 Fig 1. Overall paper stats. (left) number of papers published in each year; (right) the average number of references made and the average number of citations received for papers published in each year.
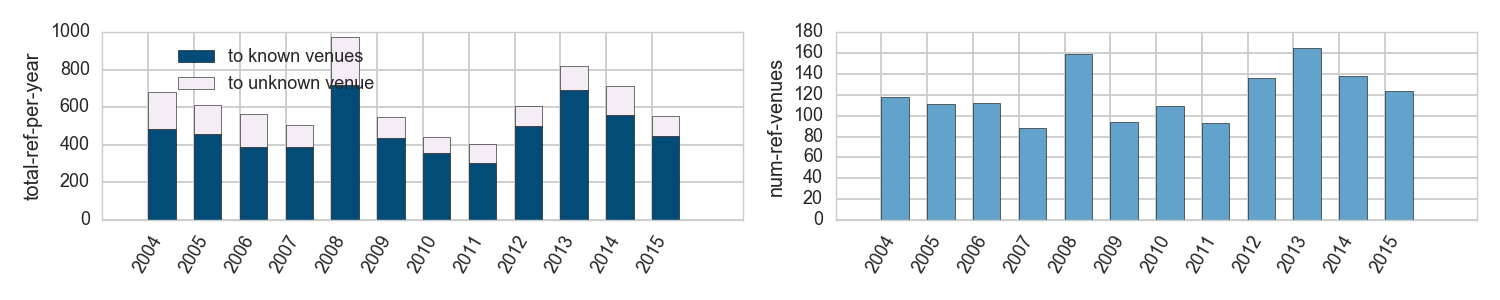 Fig 2. Overall reference stats. (left) the number of total references made by papers published in each year, broken down by known and unkonwn venues; (right) the number of distinct venues referenced by papers published in each year.
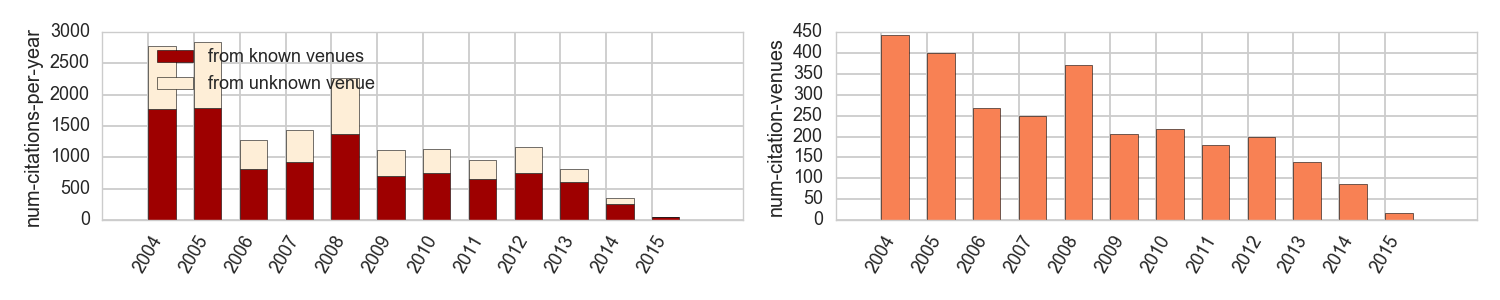 Fig 3. Overall citation stats. (left) the number of total references made by papers published in each year, broken down by known and unkonwn venues; (right) the number of distinct venues referenced by papers published in each year.

Fig 4. Summary of incoming vs outgoing citations to the top-K venues. Node colors: ratio of citations (outgoing ideas, red) vs references (incoming ideas, blue). Node sizes: amount of total citation+references in either direction. Thickness of blue edges are scaled by the number of references going to a given venue; thickness of red edges are scaled by the number of citations coming from a given venue. Nodes are sorted left-to-right by the ratio of incoming vs outgoing citations to this conference.
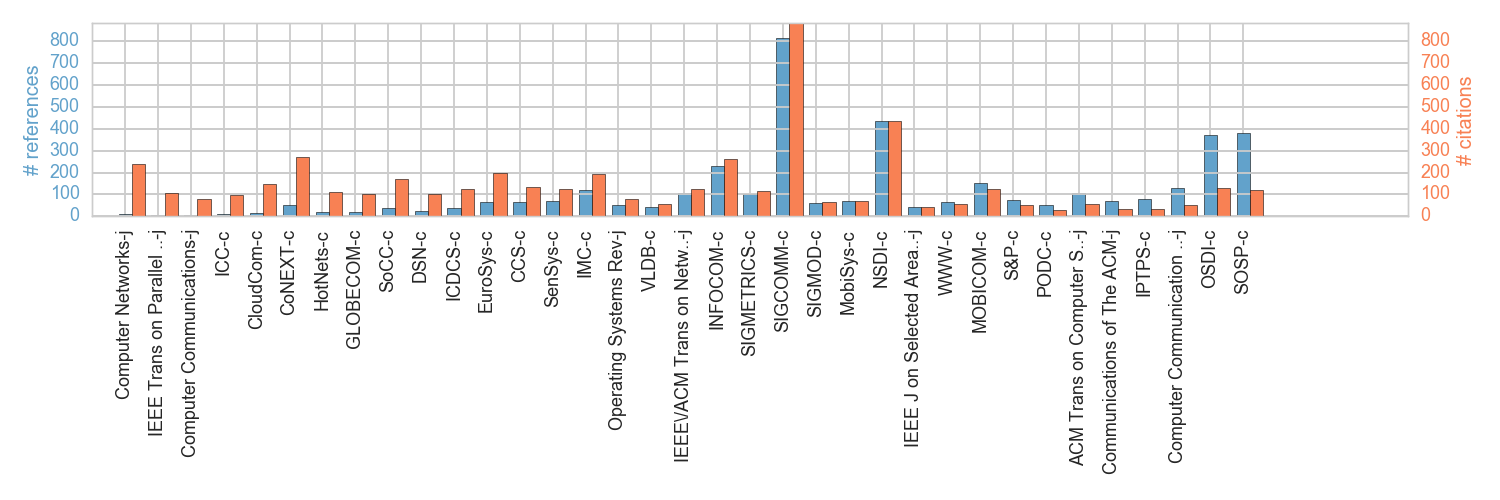 Fig 5. Incoming vs outgoing citations to the top-K venues (this bar graph presents information from the half-circle differently). (blue) The number of references going to a given conference or journal; (red) The number of citations coming from a given conference or journal. The x-axis is sorted by the ratio of incoming vs outgoing citations to the conference, highest on the right.
 Fig 6. Heatmap of references over time, broken down by publication year (horizontal axis) and reference venue (vertical axis).
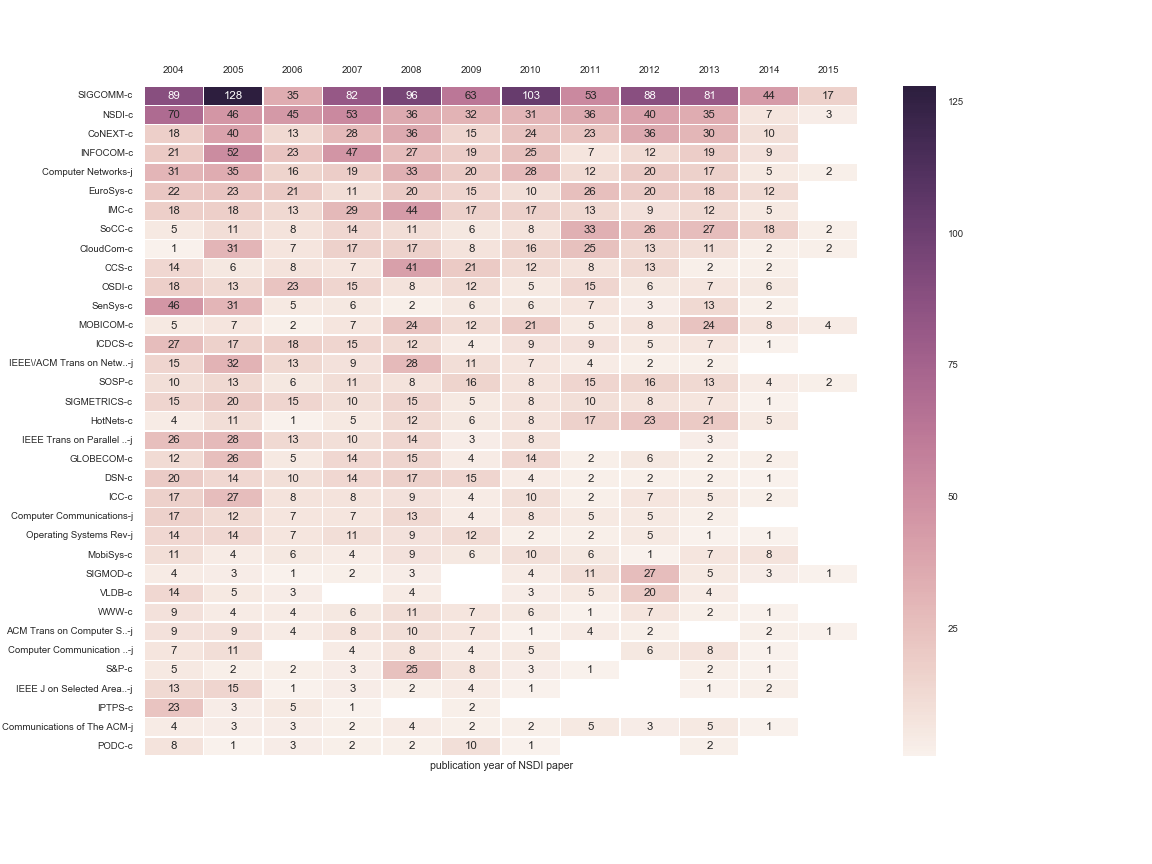 Fig 7. Heatmap of citations over time, broken down by publication year (horizontal axis) and citing venue (vertical axis).
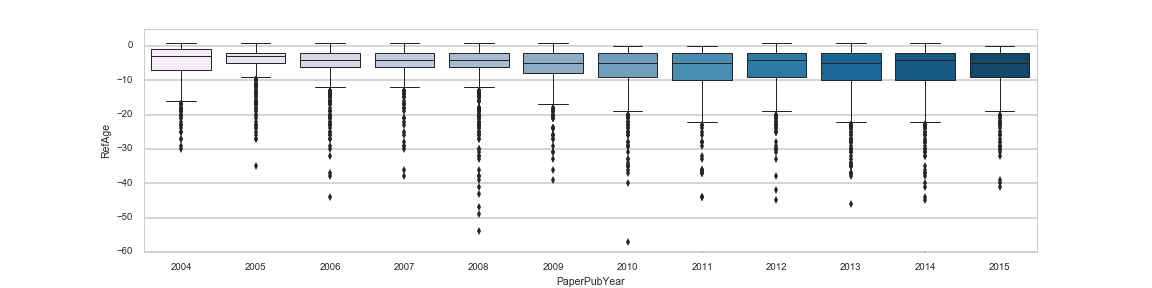 Fig 8. Box plot of reference age in years (y-axis, lower is older), broken down by the year paper in this venue is published (x-axis).
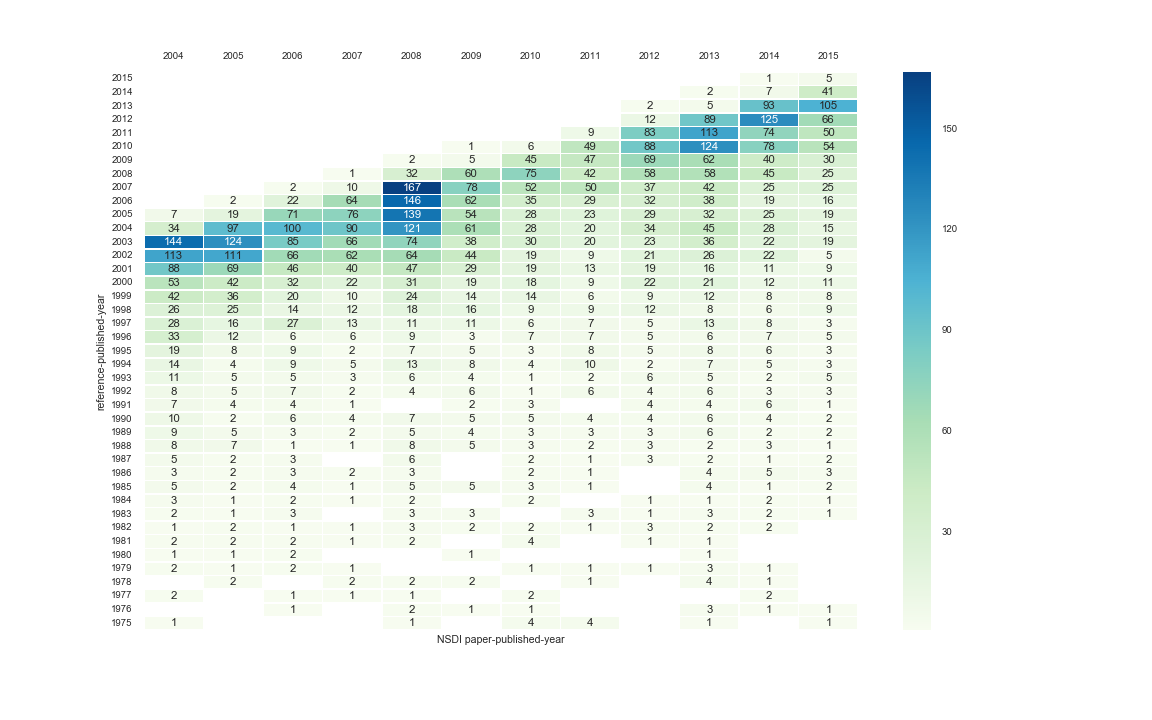 Fig 9. Heatmap of references, broken down by the year paper in this venue is published (horizontal axis) and by the publication year of the reference (vertical axis).
Fig 10. Fraction of papers that are cited at least once more than X years after they are published, with a linear regression overlay.
 Fig 11. Heatmap of the number of papers cited in each year, broken down by year published (horizontal) and year cited (vertical).
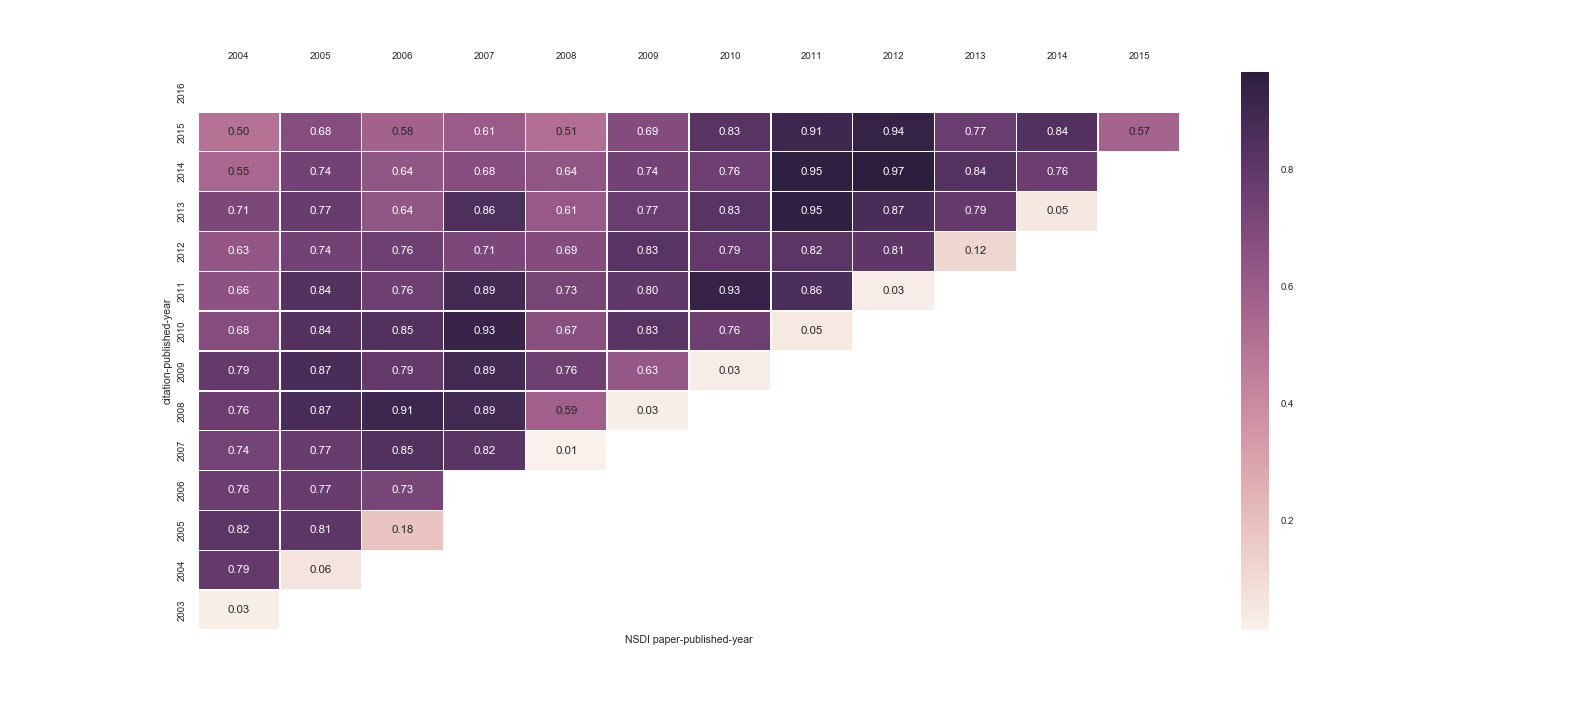 Fig 12. Heatmap of the faction of papers in a given publication years still cited in each subseuqent year, broken down by year published (horizontal) and year cited (vertical).